

【BTCJPY】20181207 Daily Pivot
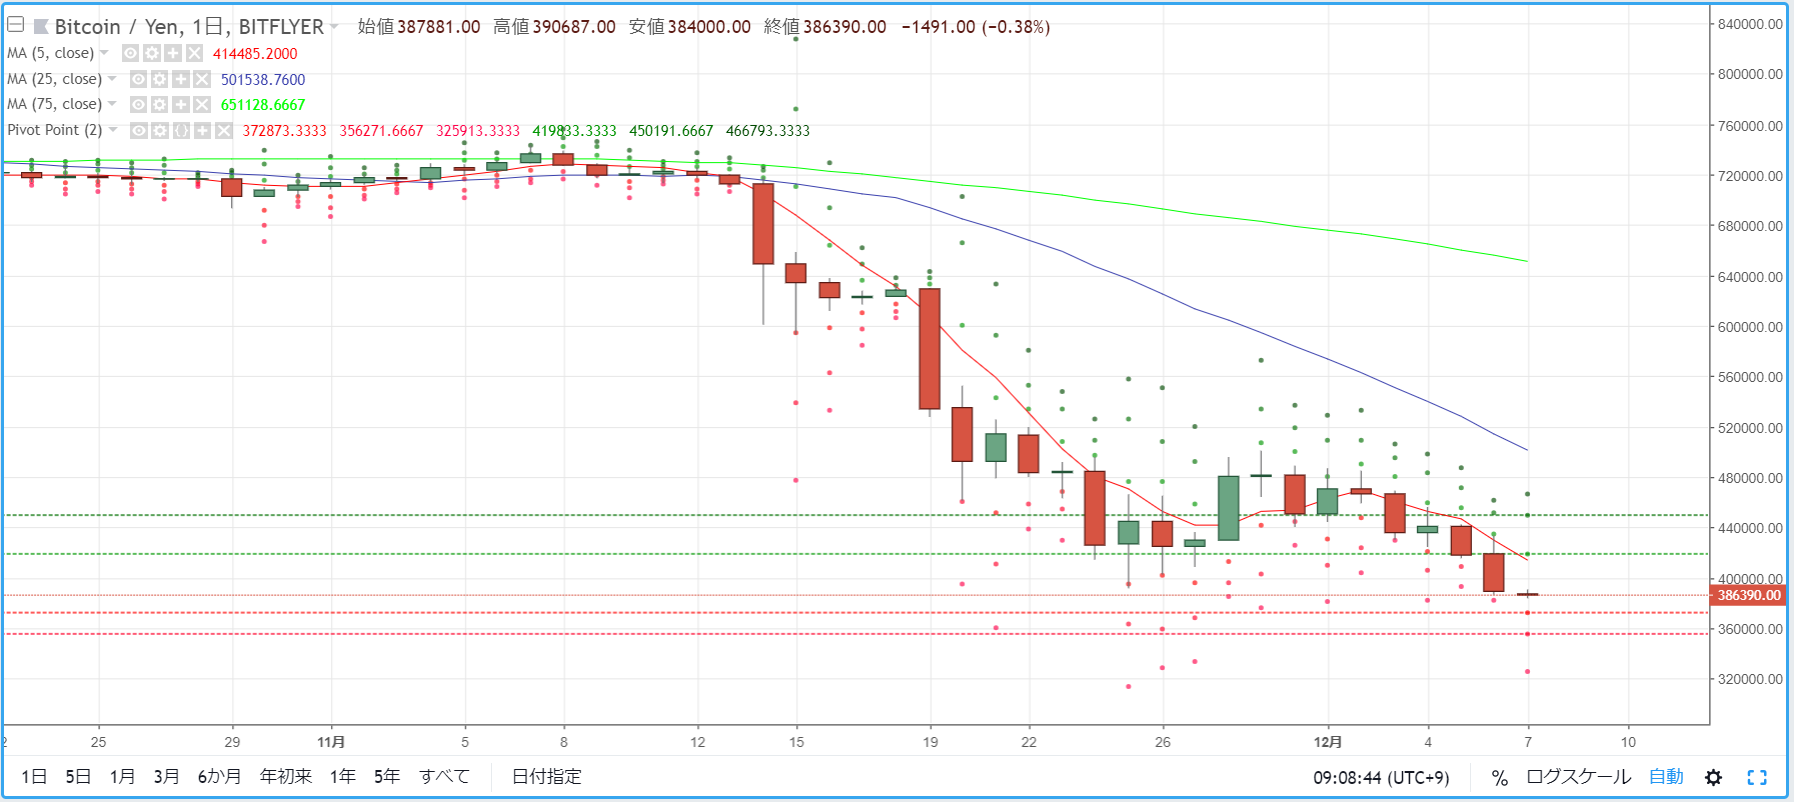
As a guideline for day trading BTCJPY, I will check the pivot. Yesterday (December 6) the 5MA briefly moved up to the low- to mid-430,000 range, but the downward momentum strengthened from there and the price closed below 400,000, in a market environment.
R2=450,191
R1=419,833
S1=372,873
S2=356,271
Note: A pivot is a technical indicator that predicts the price movement for the day based on the previous day's price action. Centering on the Pivot Point (PP), draw resistance lines (R1, R2) and support lines (S1, S2) above and below, and use them as trading guidelines.
【Calculation formulas】
Pivot Point (PP) = (Previous day's close + previous day's high + previous day's low) / 3
Resistance Line 1 (R1) = PP + (PP - previous day's low)
Support Line 1 (S1) = PP - (previous day's high - PP)
Resistance Line 2 (R2) = PP + (previous day's high - previous day's low)
Support Line 2 (S2) = PP - (previous day's high - previous day's low)


