

March 6 (Thu): 【Harmonic】 Nikkei 225 vs. US 10-Year Treasury Yield
This time
we will compare it with the so-called "economic thermometer"
“U.S. 10-year Treasury yield”
I will perform the comparison.
I have started trying the Bollinger Band indicator.
While I’m verifying its operation for the next little while, I’ll try to see if I can also make a Harmonic indicator.
I’m not confident, but… I’ll do my best!
【Indicator under development (trial)】
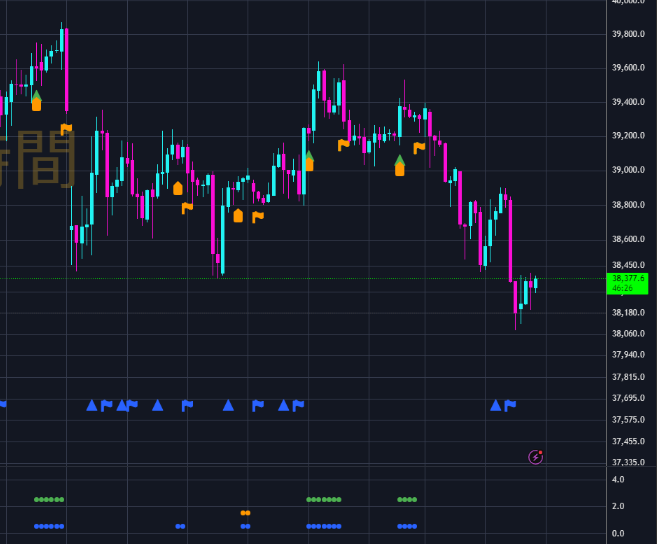
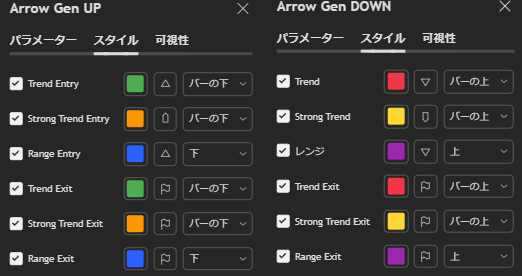
Currently, I am creating an indicator that displays higher-timeframe signals in a sub-window.
This will allow selecting signals in the same direction as the higher timeframe.
Because the indicator issues signals based on its basis, it will of course lag.
The indicator is a “lagging indicator.”
Therefore, it can lead to buying at a peak or selling at a trough.
However, I think it can provide a helpful nudge.
Please judge it based on the Bollinger Band state.
From there, you can curtail or enter,
and if a signal appears after you enter, you may hold longer.
Please understand that this is not something that earns money by the signals tool alone.
【About issues with the newsletter】
● Images within the newsletter crash.
● Font size and font color change automatically.
These phenomena are occurring.
Therefore, for a while I will write without emojis or colors.
There is no change in content, so please understand…
(※Below is for members only.)


