

【BTCJPY】20181205 Daily Pivot
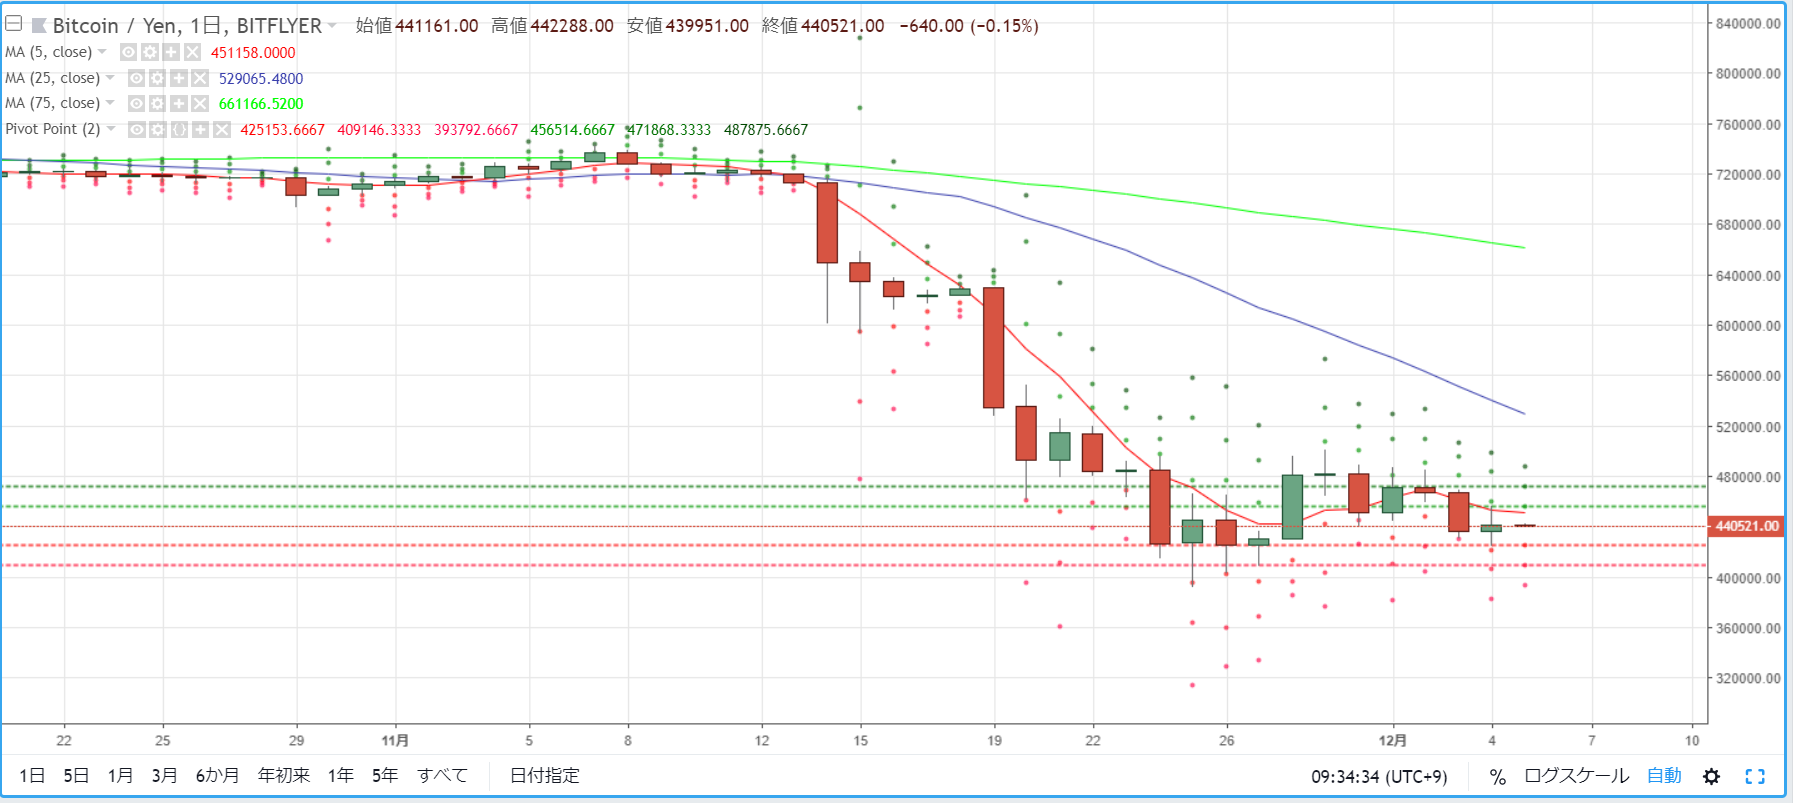
As a guide for day trading BTCJPY, we check the pivot. Yesterday (December 4) formed a small bullish candle. At one point it crossed the 5MA near 450,000 yen, but the market retraced and closed in the 440,000 yen range.
R2=471,868
R1=456,514
S1=425,153
S2=409,146
※ A pivot is a technical indicator that predicts the price movement of the current day based on the previous day's price action. Centered on the Pivot Point (PP), lines are drawn above and below: Resistance lines (R1, R2) and Support lines (S1, S2), which are used as trading guides.
【Calculation Method】
Pivot Point (PP) = (Previous day's close + previous day's high + previous day's low) / 3
Resistance Line 1 (R1) = PP + (PP - previous day's low)
Support Line 1 (S1) = PP - (previous day's high - PP)
Resistance Line 2 (R2) = PP + (previous day's high - previous day's low)
Support Line 2 (S2) = PP - (previous day's high - previous day's low)


