

March 3 (Mon): [Bollinger Bands] Nikkei 225 VS Russell 2000
Even though it's fast, it's already March.
The monthly chart is also confirmed, but how will last month's decline affect future scenarios?
Let's take a good look at it.
This time
we will compare with the so-called "canary in a coal mine" that leads a downtrend'Russell2000'
in comparison.
【In-progress Indicator (trial)】
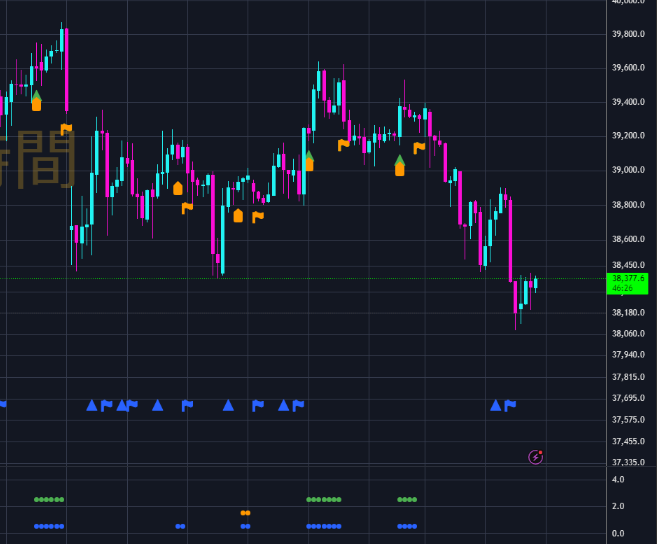
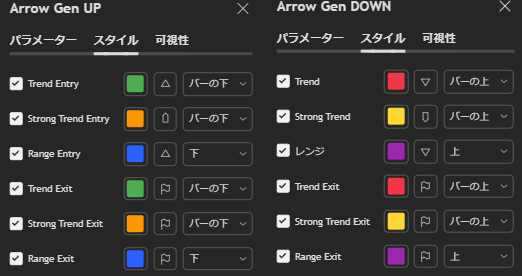
Currently, I am developing an indicator that displays the higher-timeframe signals in a sub-window.
This will allow you to filter signals in the same direction as the higher timeframe.
Since signals are generated based on the indicator, they will of course be delayed.
Because the indicator is a "lagging indicator".
Therefore, you may end up catching the top or the bottom.
However, it may serve as a helpful push in the back.
Please judge based on the state of the Bollinger Bands.
From there, you may choose to filter and enter,
or if a signal appears after you enter, you may hold longer.
Please understand that this is not something you can rely on to make money with just a signal tool.
【About issues with the newsletter】
● Images in the newsletter crash.
● Font size and text color change on their own.
These issues are occurring.
Therefore, for a while I will write without emojis or colors.
There is no change in content, please understand…
(※Below is for members only.)


