Principles of the market: Technical breakdown → bias (advantage) arises → big earning opportunity!
0
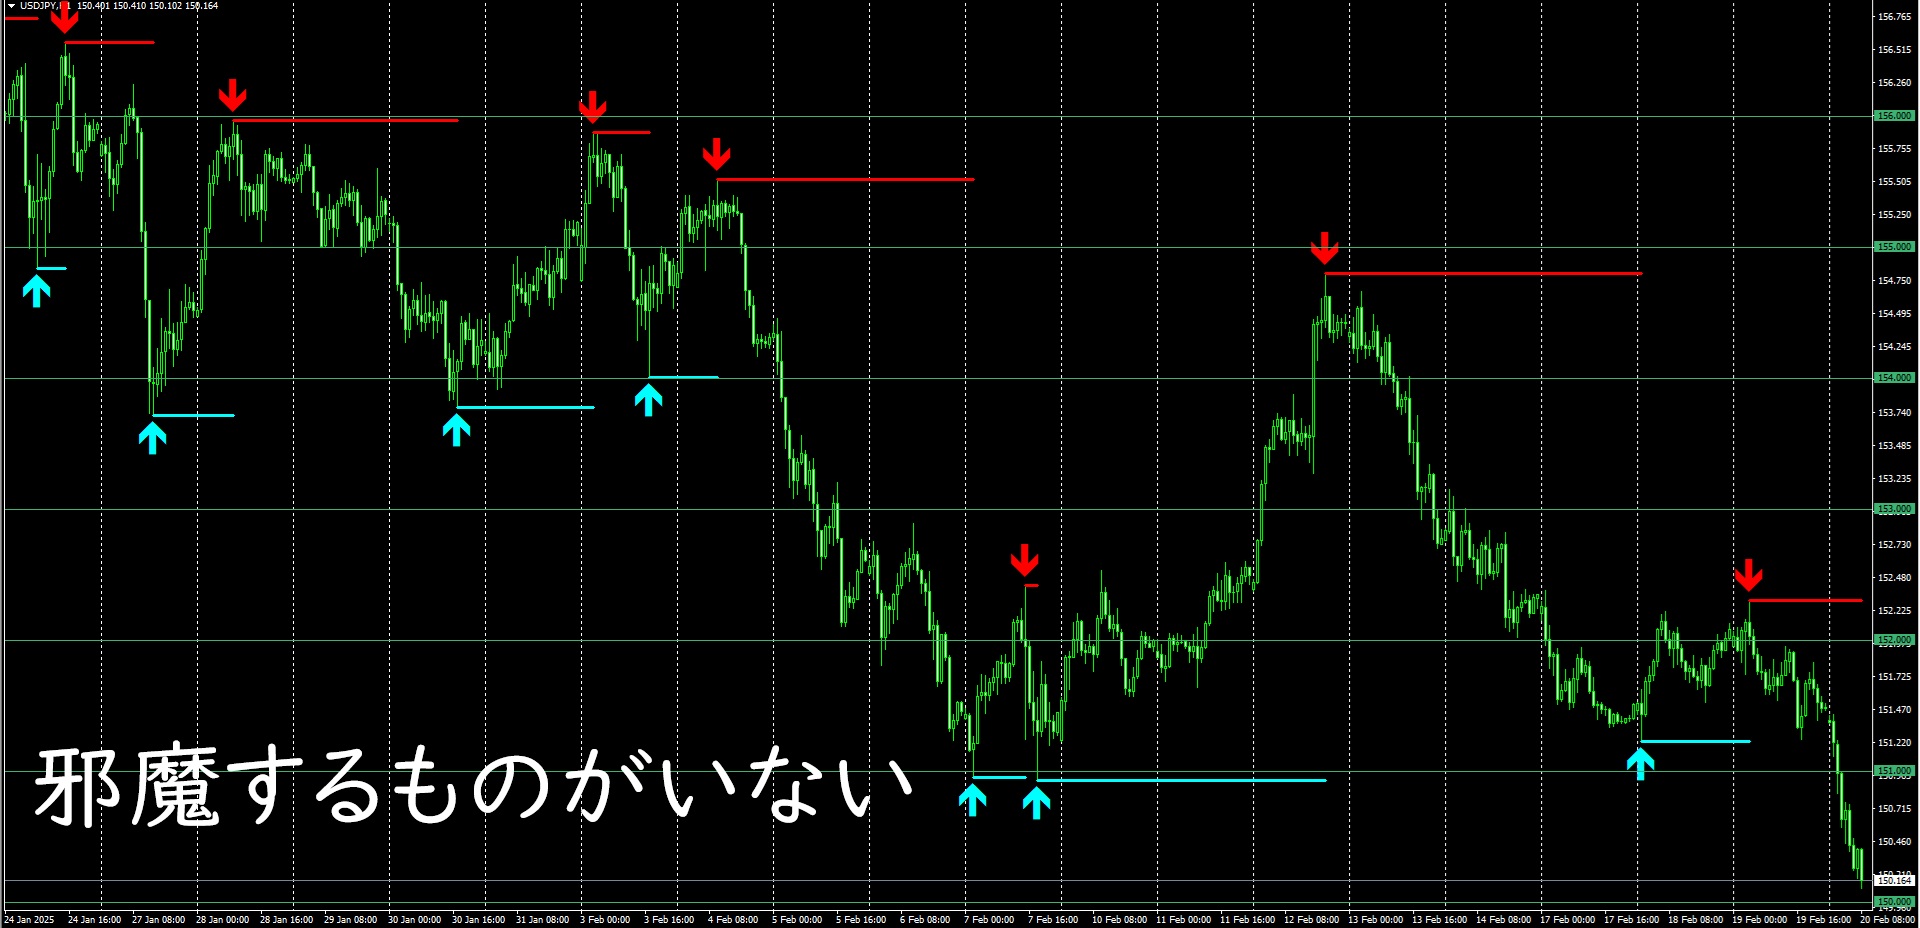
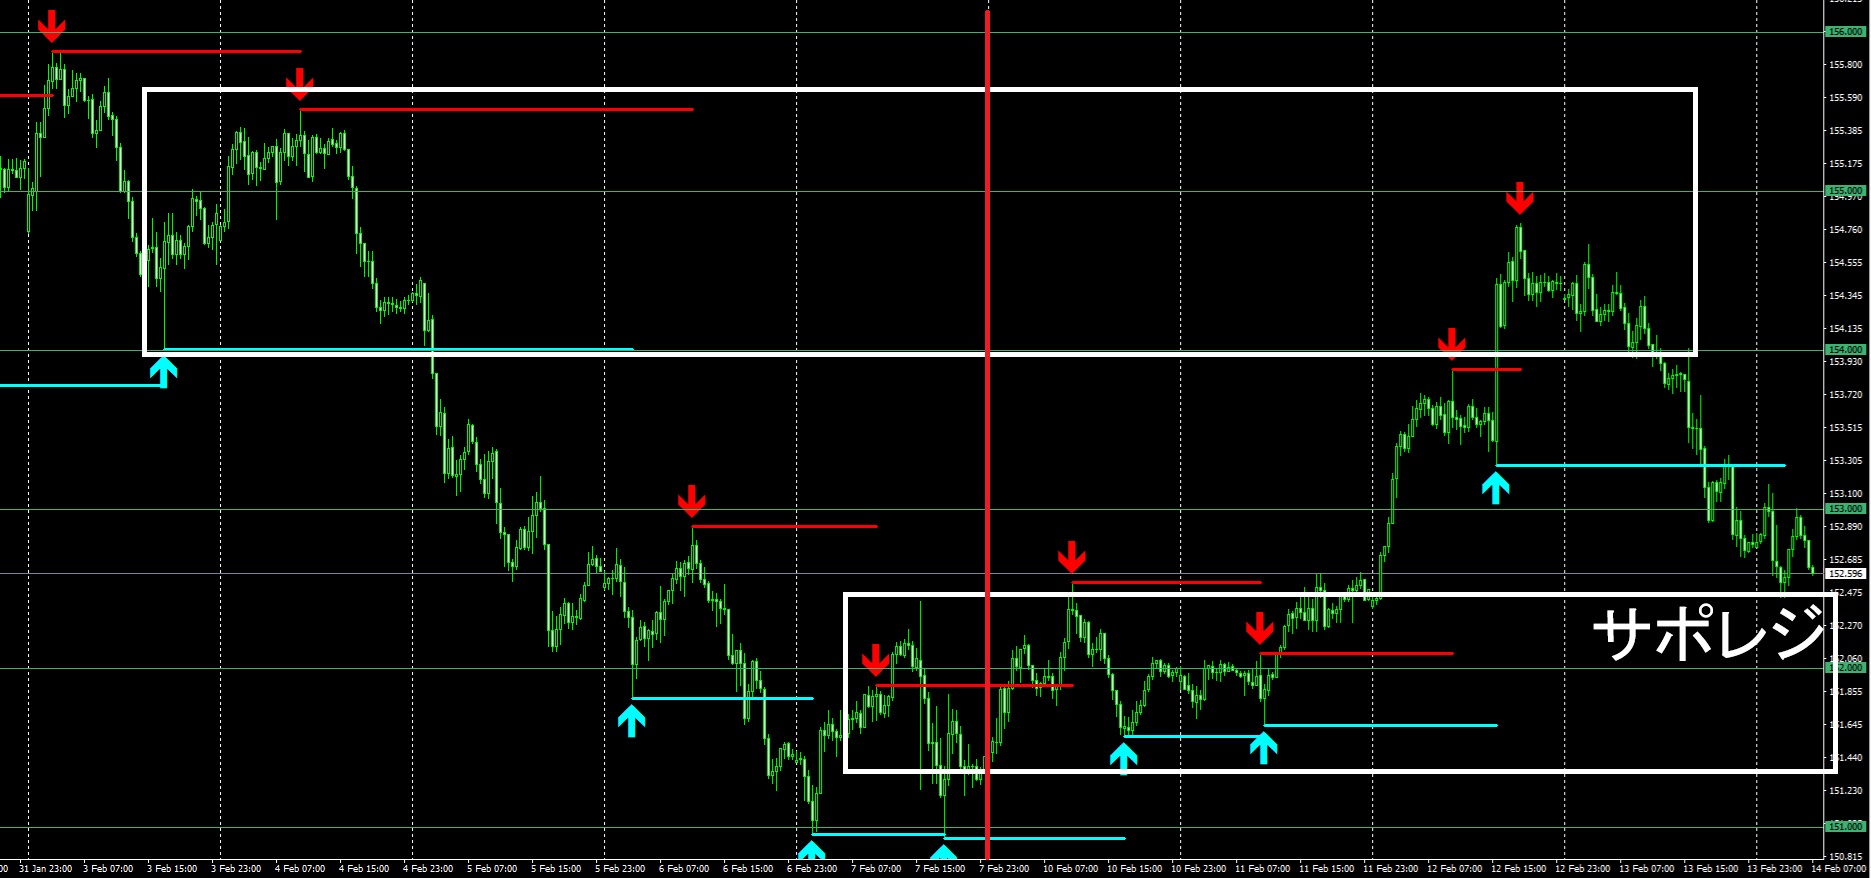
As of now (February 20, 2025, 15:40), this is the one-hour chart of USD/JPY.

In this morning's video I was discussing how the triangle consolidation on the 1–4 hour timeframes could break at any moment, and that once it breaks, the next move would be toward 150 yen…I started to see new lows after that, but the decline has continued without a rebound.
Because there is nothing left on the left to block it.
On February 7, after being supported by a four-hour inverted head-and-shoulders (formed in early December) and forming a double bottom, it rose by 400 pips.
This week from Monday to Tuesday, supported by that double bottom from that time, it paused briefly and showed a trend reversal on the 5–15 minute timeframe.
On the following Wednesday, after a false move that pushed to a high, it formed a lower high and a triangle consolidation, and by early Thursday it gave off an aura that it was about to test a new low, continuing to the present.
If the progression had continued as before, it would have formed a triangle consolidation on the 1–4 hour timeframe, but the move to break that implies, conversely, that selling pressure is increasing to that extent.
A level that should have held did not hold → technicals broke → a strong force is at work → the balance of supply and demand has shifted.
With this understanding, how can one use the situation to make money?
Needless to say… right?
The original indicator I use can be downloaded for free.
↓ Download here
× ![]()