Dollar-Yen: Today's key points! Will it bounce off the resistance line created by last week's employment statistics and continue forming a triangle consolidation?
0
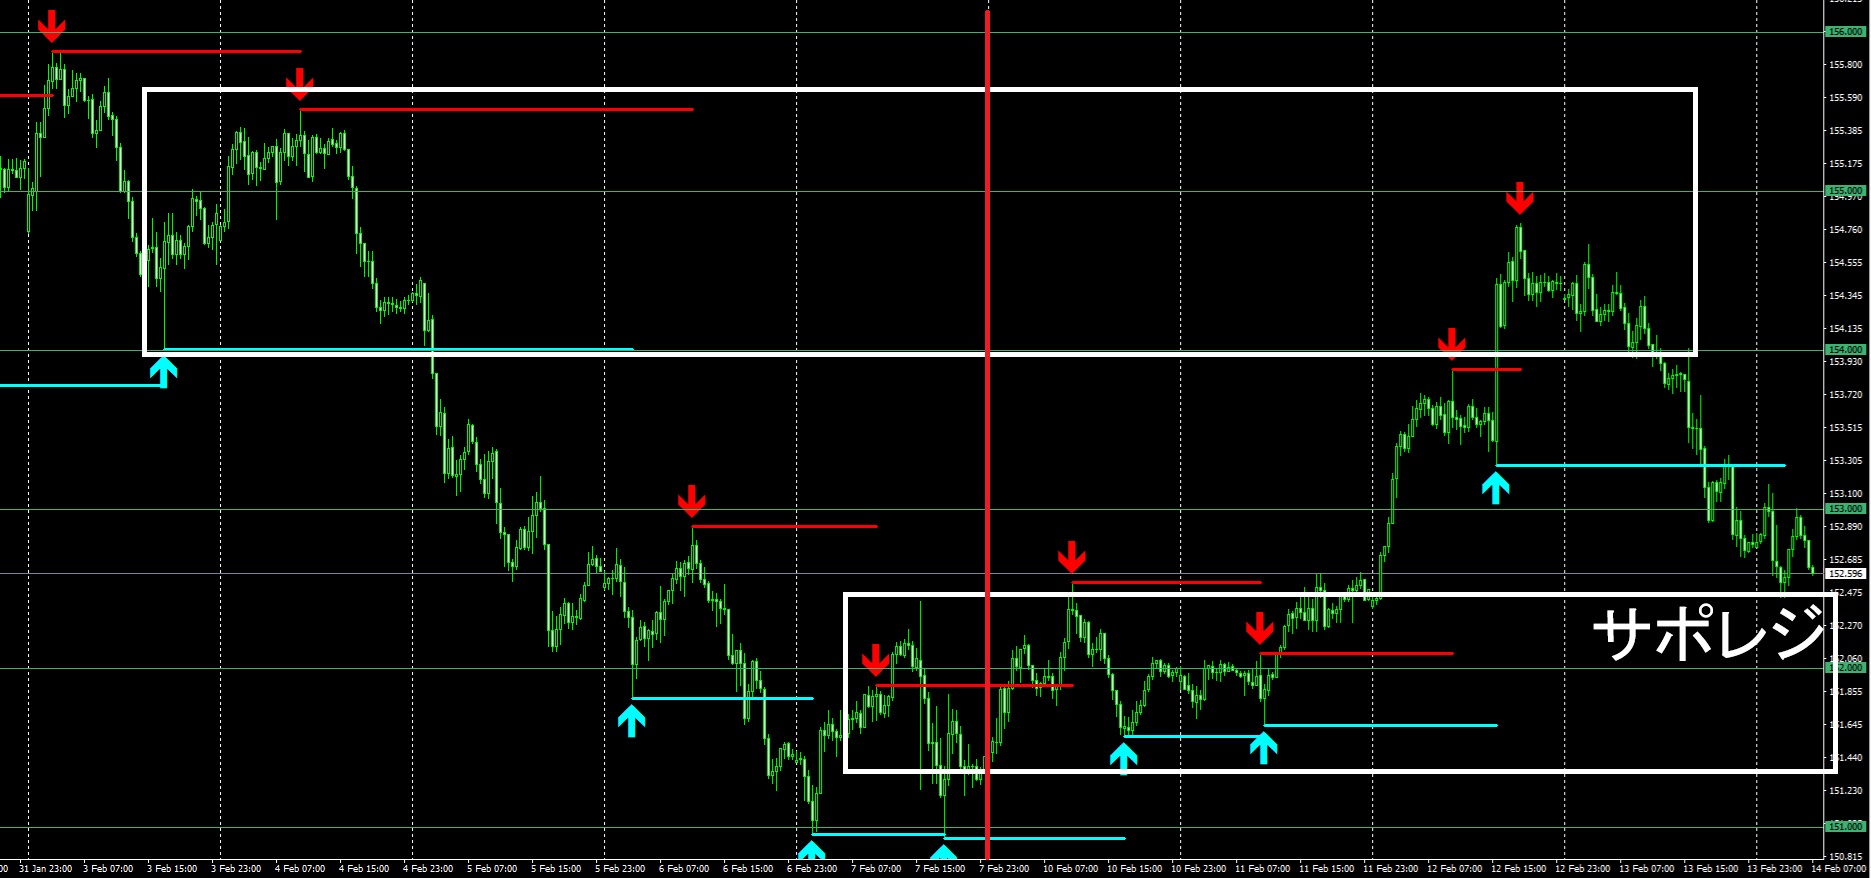
As of now (February 14, 2025, 14:10), this is the USD/JPY 30-minute chart.

Recently, it has started to resemble the chart pattern of the “real shape of triangle consolidation” that I’ve been featuring in videos.
There is also an economic indicator at 22:30 today, but more than that, I think other traders are noticing that it is Friday, the weekend.
The red vertical line marks the boundary of the week, but compared to the rise from Monday to Wednesday, it has already pulled back by more than half, and it is reacting to support/resistance at the resistance line formed by last week’s employment data.
Whether it will turn up again here, or whether it will wobble within the zone for a while and fall to Monday’s level… that’s the current question.
The original indicator I use is available for free download.
↓ Download here
× ![]()