

February 20 (Thu): [Bollinger Bands] Nikkei 225 vs. U.S. 10-Year Treasury Yield
This time
We will compare it to what is called the “economic temperature.”
“U.S. 10-year Treasury yield”
.
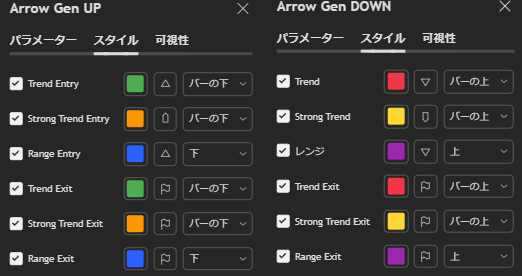
【Indicator in development (trial)】

Signals are issued based on the indicator, so of course there is a delay.
Because the indicator is a “lagging indicator.”
Therefore, you may get caught at a peak or a trough.
However, it may give you that extra push to take action.
Please judge based on the state of the Bollinger Bands.
From there, you can select and enter, or once you enter and a signal appears, you may hold longer.
Please understand that this is not something you can earn solely with a signal tool.
【Issues with the email newsletter】
● Images in the newsletter crash.
● Font size and text color change automatically.
These issues are occurring.
Therefore, for a while, I will write without emojis or colors.
There is no change in content, please understand…
(※ below is limited to members only.)


