
Introduction to convenient features of the line assist tool
Introduction to Useful Features of the Line Assist Tool
This tool provides features such as easily changing the properties of trend lines, turning diagonal lines horizontal with one click, and labeling touchpoints along a line to make it easier to see how many times the line has been touched.The product page is here, so please refer to the product page for specific features.
By the way, what makes this tool truly convenient is its automatic adjustment of trend lines according to proper drawing methods.
Do you know the correct way to draw a trend line?
Aren’t you easygoing about connecting obvious high or low points as touchpoints?
What is the Correct Way to Draw Trend Lines
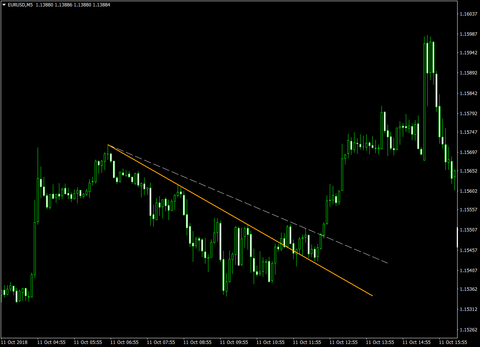
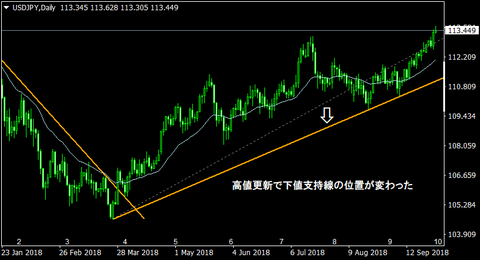
In the above figure, which is the correct upper resistance line, the orange line or the white dotted line?
Please take a moment to think about your usual method.
The correct answer is the orange line.
There is no absolute correct answer in trading, so strictly speaking, the line that traders around the world are drawing is the orange line.
★ For an upper resistance line, it is drawn by connecting the high prior to the highest point of the wave and the preceding low point.
★ For a lower support line, it is drawn by connecting the low prior to the lowest point of the wave and the preceding high point.
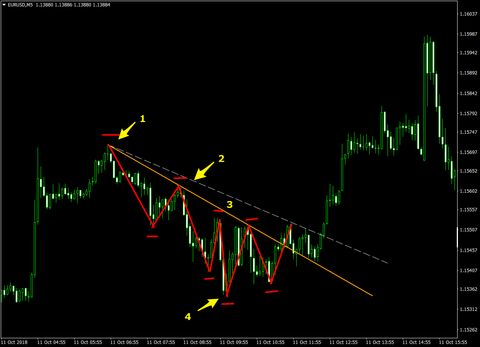
In this example, starting from point 1, the line drawn by connecting the high at point 2 before reaching the lowest point at 4 is the correct upper resistance line.
Since the high at point 3 is below the high line at point 2, it should be ignored here.
And after point 4, as the low point rises and the orange line breaks, the orange line changes from resistance to support and rises.
Thus, it is clear that a correctly drawn line is easier to use.
As time progresses, you need to redraw the line to match updated highs and lows.
When drawing lines on multiple time frames, this task becomes even more challenging.
To save you the trouble, this tool includes a feature that automates line adjustment.
How Line Auto-Adjustment Works in Detail
This tool’s automatic line adjustment has two patterns.
[POS] Adjustment method determined by the time of the second touchpoint position you drop
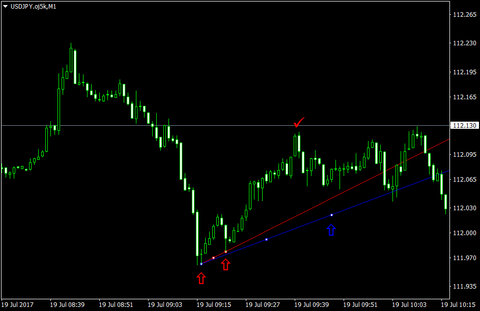
- In the case of a lower support line
- Adjusts to a trend line that connects two lows before the highest value bar between the starting point and the next point.
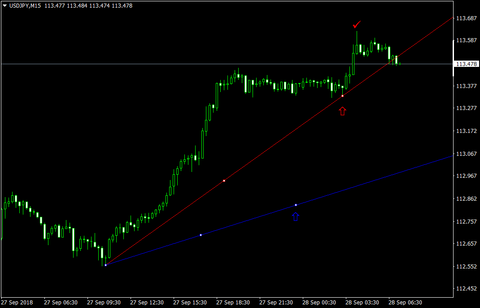
- As in the example below, if you manually draw the blue line, the tool will search for the highest red check mark between the starting point and the blue arrow, then look for two lows before the red check mark, and automatically adjust so that the line between the two lows does not intersect the bar, resulting in a red line.
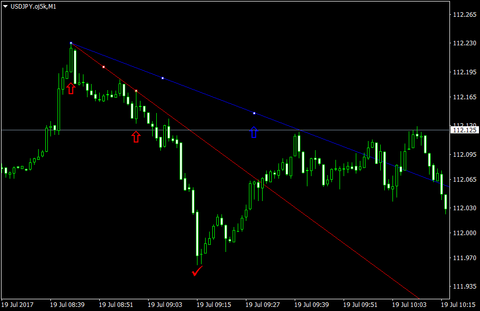
- In the case of an upper resistance line
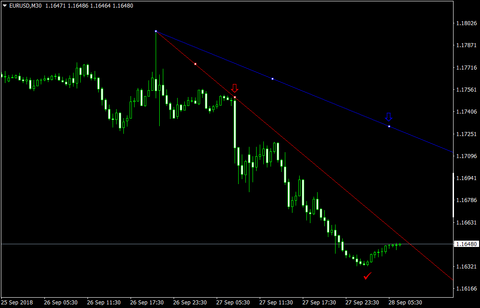
- Adjusts to a trend line that connects two highs before the lowest value bar between the starting point and the next point.
- As in the example below, if you manually draw the blue line, the tool will search for the lowest red check mark between the starting point and the blue arrow, then look for two highs before the red check mark, and automatically adjust so that the line between the two highs does not intersect the bar, resulting in a red line.
※ If the second point is higher than the starting price, it is recognized as a lower resistance line; if the second point is lower than the starting price, it is recognized as an upper resistance line.
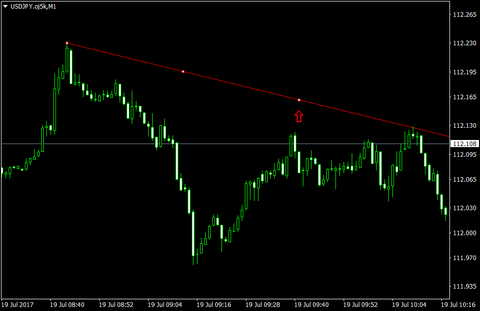
If you want to readjust automatically again, move the second-point apex to the red arrow shown in the diagram below.
The tool will automatically search for the highest and lowest bars corresponding to the new second point and redraw the line.
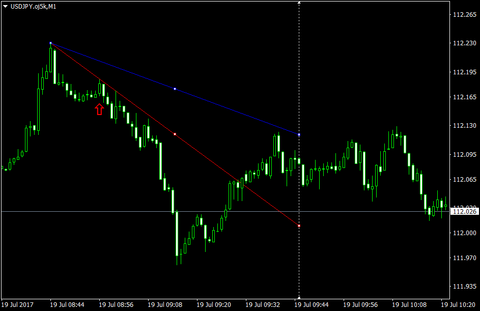
If the “Extend line” option in the trend line parameters is not checked, the line will be adjusted to connect the second point and the starting point, and the second point will not be an apex preceding the highest or lowest point.
In other words, as shown below, if you manually draw the blue line, the second point will be adjusted so that the red arrow becomes the apex after the start within the chosen time axis.
[Time] Automatically determine the second touchpoint at each candle close
- In the case of a lower support line
- Adjusts to a trend line that connects two lows before the highest value bar up to the current time.
- As in the example below, if you manually draw the blue line, the tool will search for the highest red check mark up to the current time, then look for two lows before it, and automatically adjust so that the line between the lows does not intersect the bars, resulting in a red line.
- In the case of an upper resistance line
- Adjusts to a trend line that connects two highs before the lowest value bar up to the current time.
- As in the example below, if you manually draw the blue line, the tool will search for the lowest red check mark up to the current time, then look for two highs before it, and automatically adjust so that the line between the highs does not intersect the bars, resulting in a red line.
If you set “Keep original line after automatic adjustment for high/low update” to true, you can keep the original line when automatic updates change its position.
However, if a line is in a selected state, the feature to keep the original line is disabled (to prevent users from accidentally leaving the old line when adjusting).
Example of the line position being updated
How the line automatically updates
That concludes the overview of the line automatic adjustment, a standout feature of the Line Assist Tool.
We hope it assists with your discretion-based trading.
× ![]()