Real-time Trade Using an EA Craftsman Free Indicator (February 3, 2025)
0
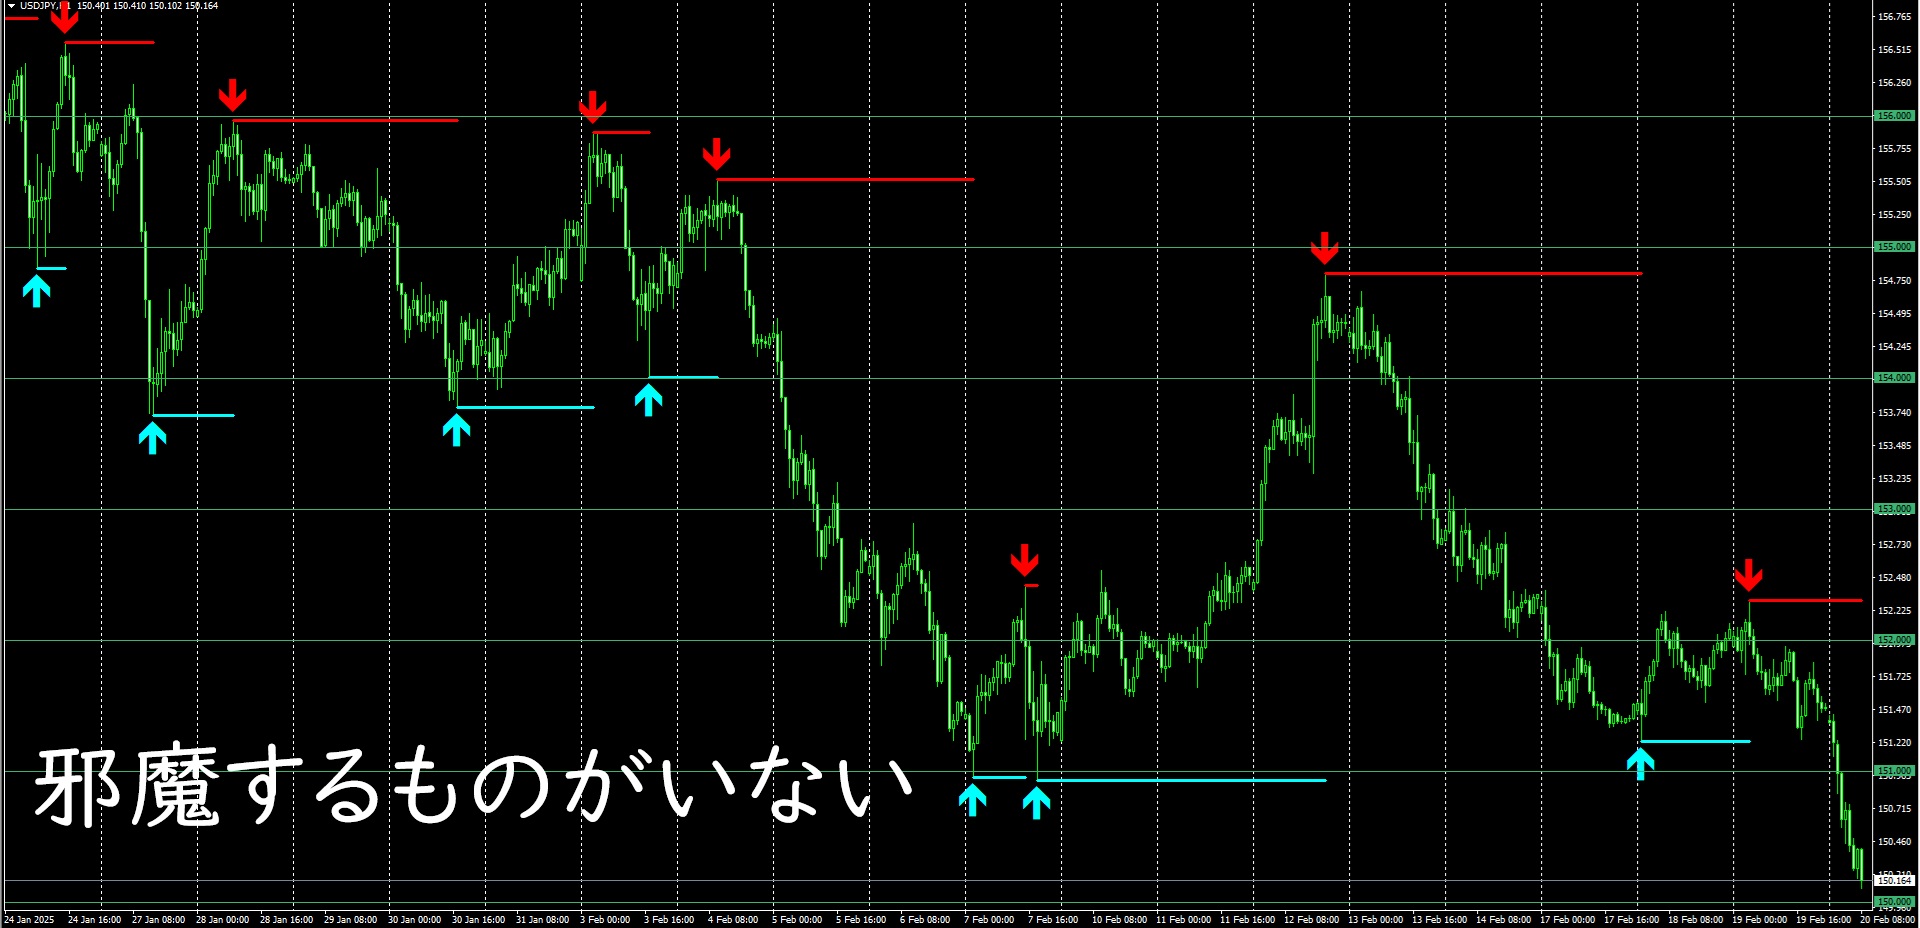
Around 9:00 AM yesterday (February 3, 2025), I applied a free indicator that I developed to a one-minute USD/JPY chart.
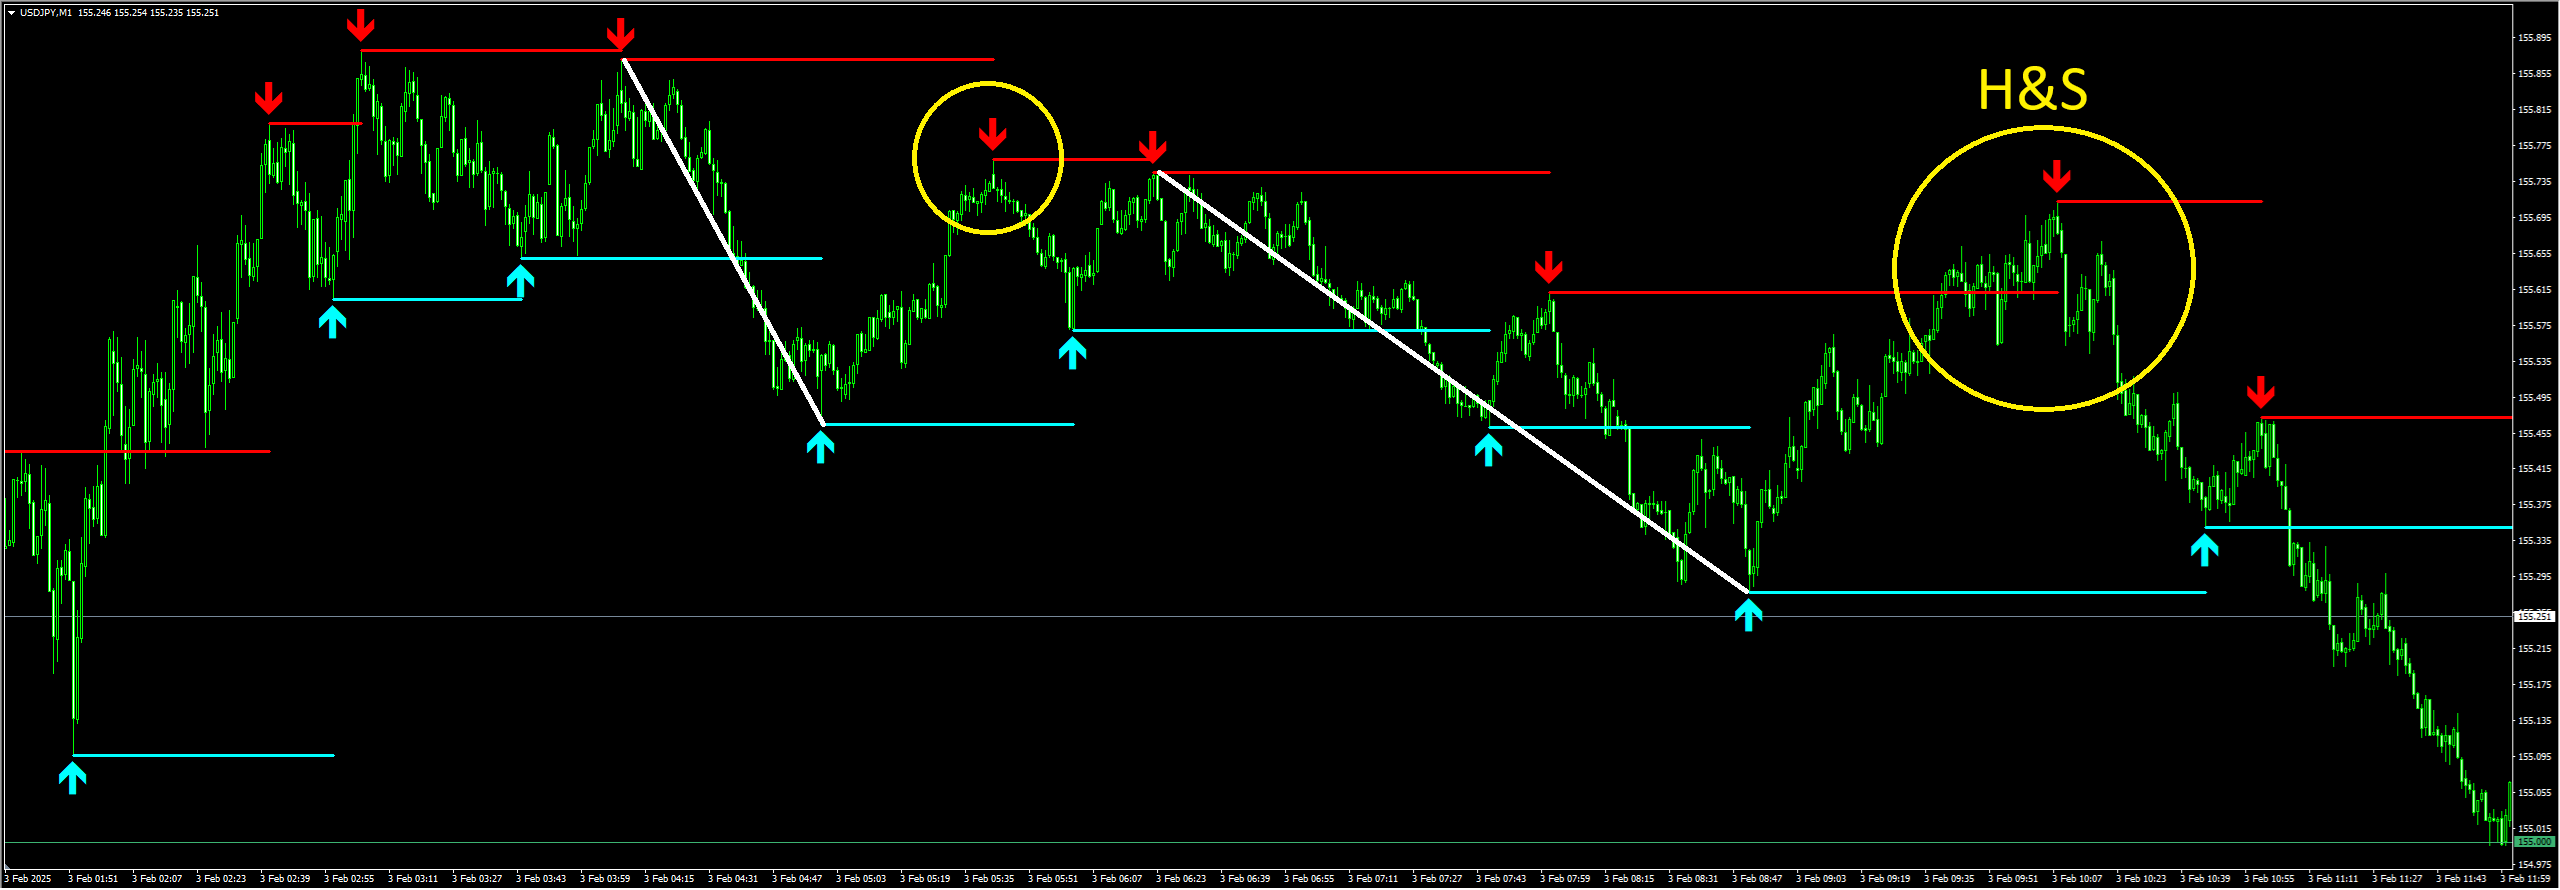
First, please take a look at the first half of the image.
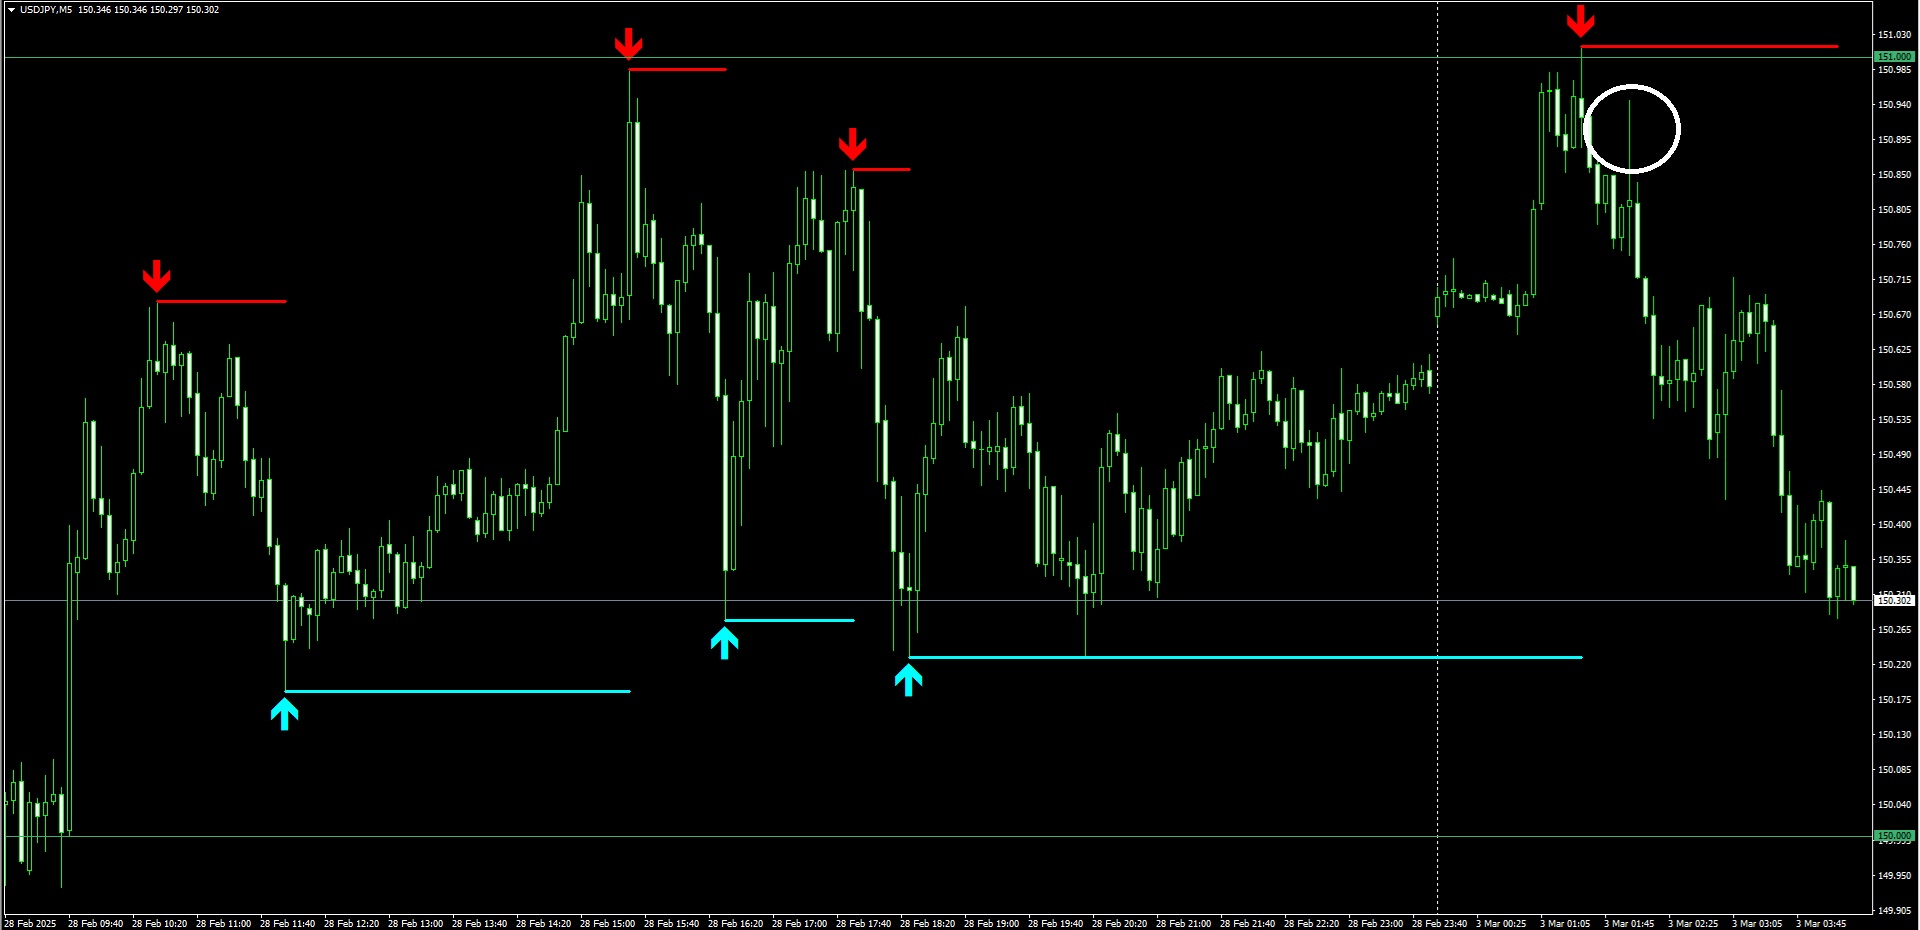
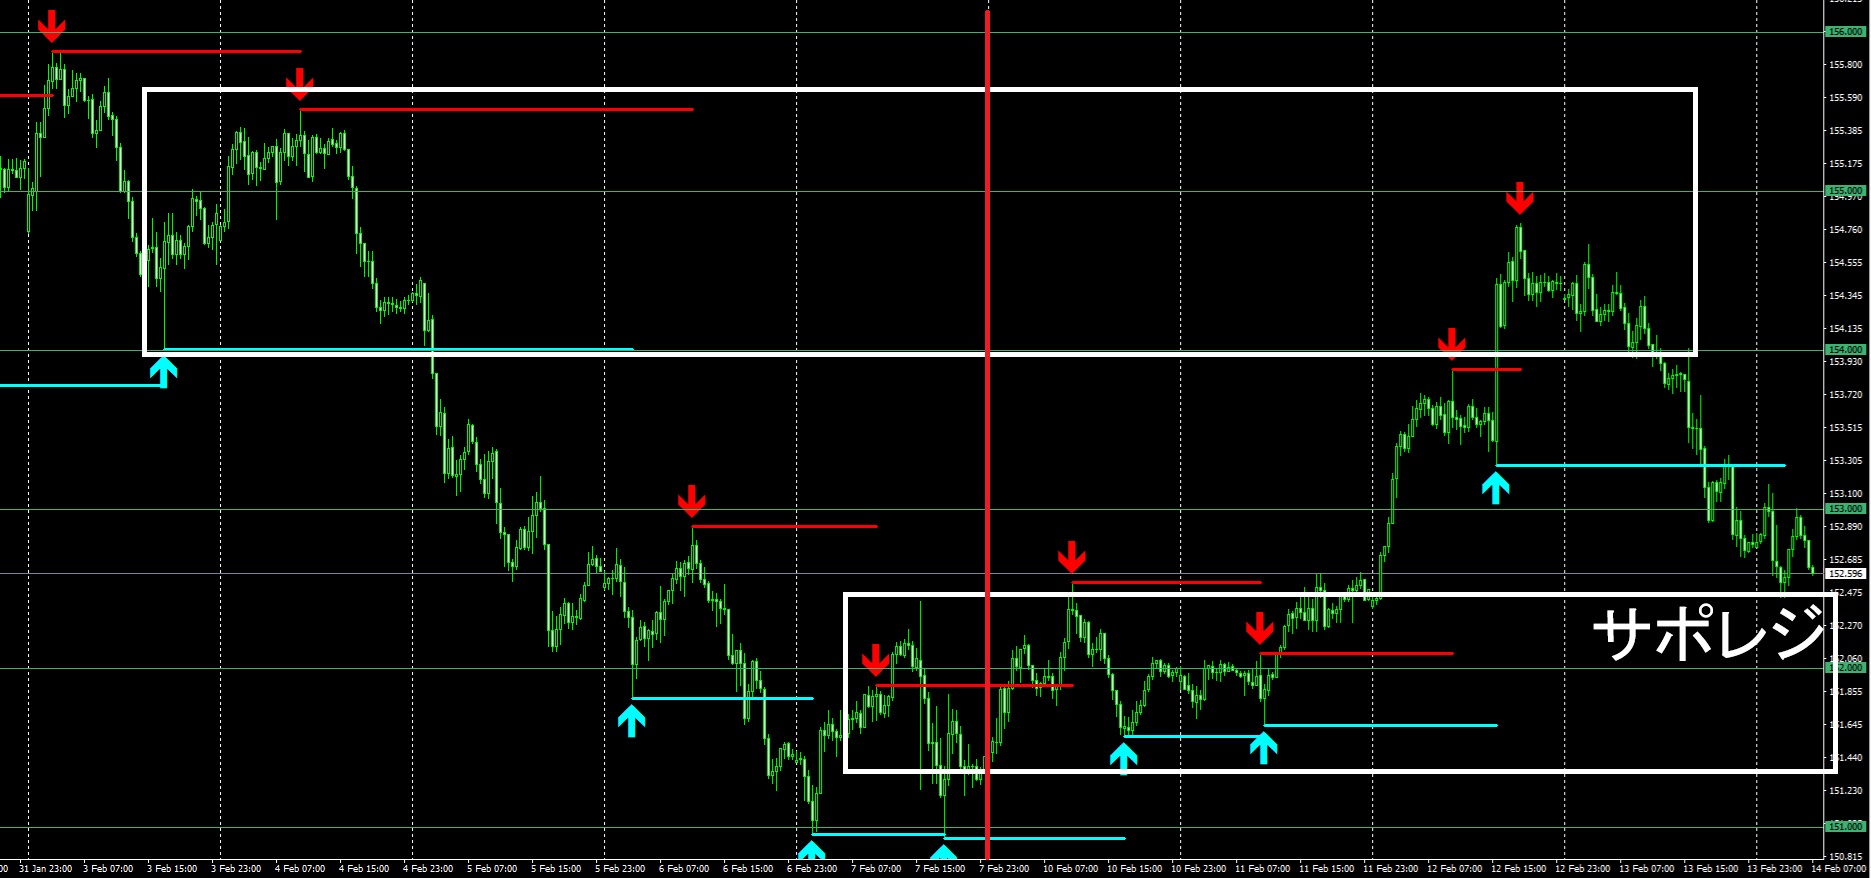
The spots where the red arrows and horizontal lines are fixed indicate resistance, so after breaking below the light blue support, you would sell against the resistance (yellow circle).
The second half is the same. Here, at the potential reversal area, a Head and Shoulders (H&S) pattern is forming, so I think a more advantageous entry could have been made.
↓ Download is available from here.
× ![]()