

【BTCJPY】20181126 Daily Pivot
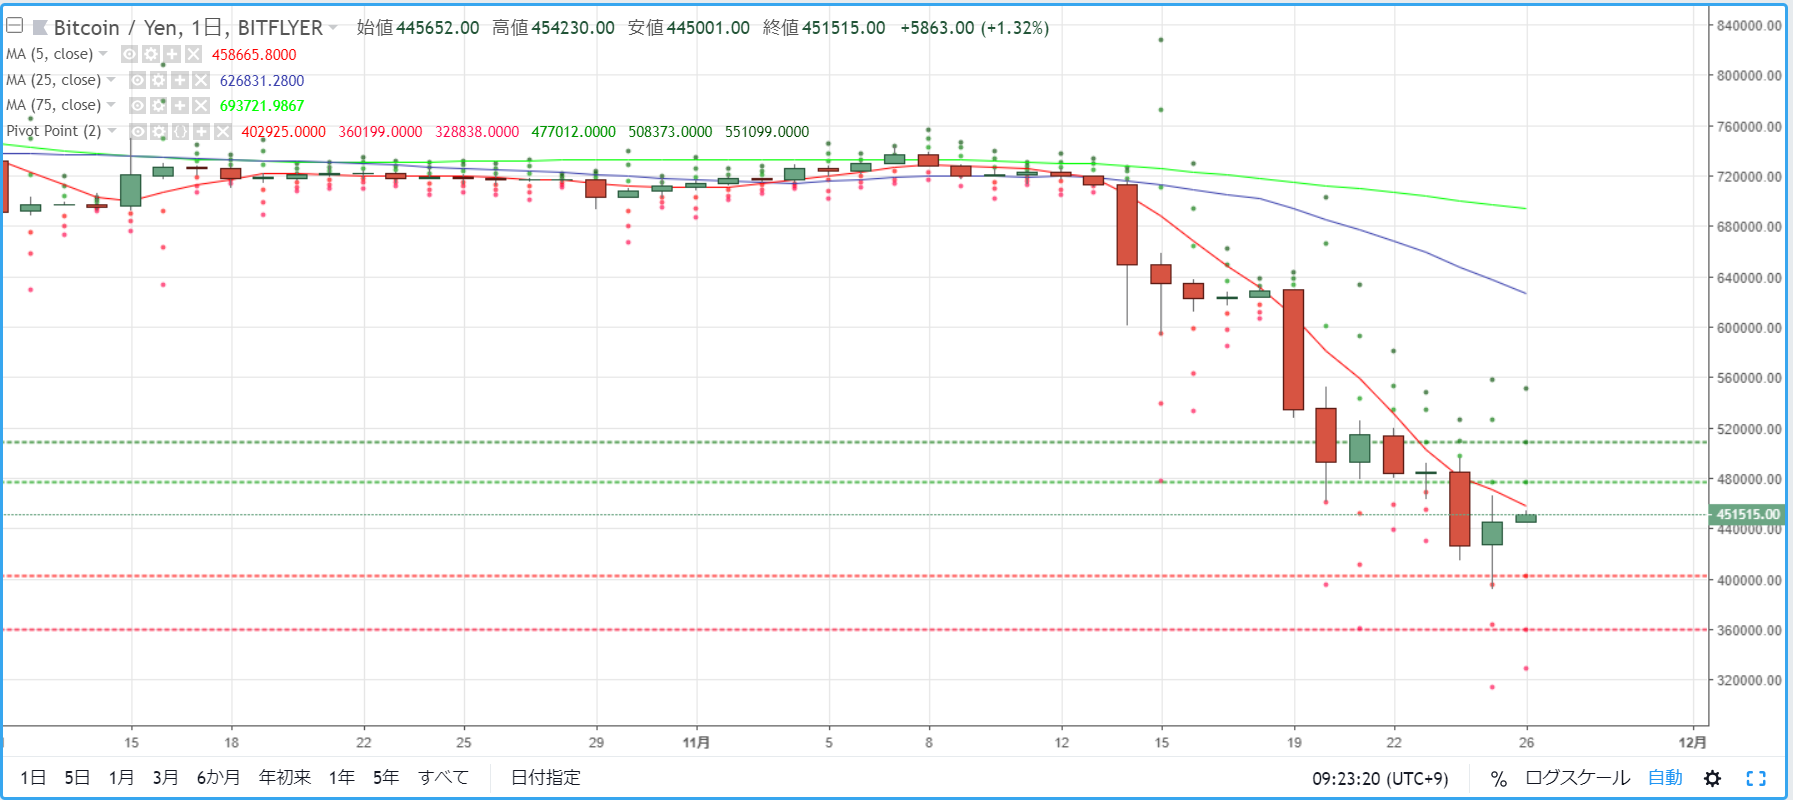
As a guideline for day trading BTCJPY, we will check the pivot. Yesterday (November 25) it briefly dipped below 400,000 yen but recovered to the 440,000 yen range and formed an bullish candlestick in the market environment.
R2=508,373
R1=477,012
S1=402,925
S2=360,199
※ A pivot is a technical indicator that predicts the price movement for the current day based on the previous day's price action. Centered on the Pivot Point (PP), draw resistance lines (R1, R2) and support lines (S1, S2) up and down, and use them as trading benchmarks.
【Calculation Formula】
Pivot Point (PP) = (Yesterday's close + Yesterday's high + Yesterday's low) / 3
Resistance Line 1 (R1) = PP + (PP - Yesterday's low)
Support Line 1 (S1) = PP - (Yesterday's high - PP)
Resistance Line 2 (R2) = PP + (Yesterday's high - Yesterday's low)
Support Line 2 (S2) = PP - (Yesterday's high - Yesterday's low)


