
USD/JPY shows an up signal, near-term upside target (Elliott Wave Theory・Point and Figure)
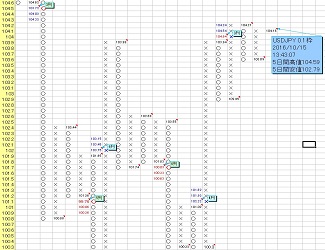
Daily chart 0.1 yen standard frame P&F chart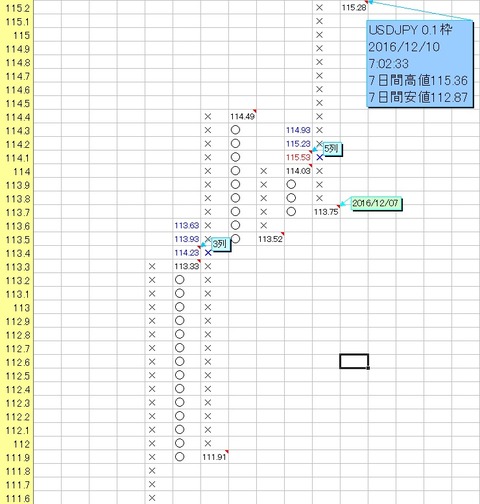
Daily chart 0.2 yen standard frame P&F chart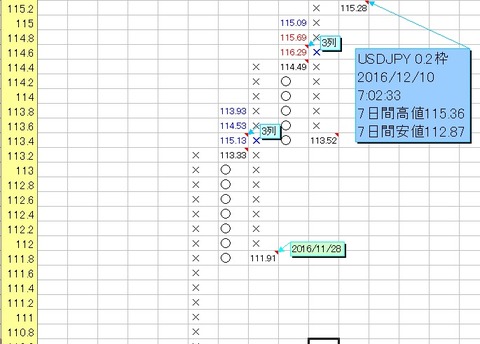
![]()
As stated above, an additional bullish signal has occurred on the USD/JPY daily chart with 0.1 yen and 0.2 yen standard frames in the Point and Figure chart.
The maximum target for the 0.1 yen frame has almost reached 115.53 yen.
The maximum target for the 0.2 yen frame is calculated automatically from the tool as 116.29 yen.
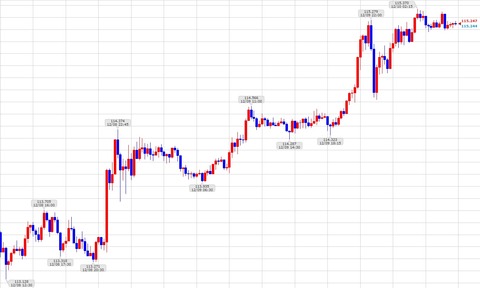
Now, the upward move starting from the recent low of 12/8 12:30 at 113.128 yen, the upper target rangewill be calculated (numbers refer to the Platinum Chart from GMO Click Securities mentioned above).
If we take 113.128 at 12/8 12:30 as Wave 1 start value, 113.705 at 16:30 as Wave 1 high, and 113.271 at 20:30 as Wave 2 low, the Wave 5 target is calculated as 114.9952 yen ~ 115.5722 yen, and it is already near the maximum Wave 5 target.
From the above, the near-term upper target is likely in the mid to upper 115 yen range.
Multiple standard frames' Points & Figures (Secret Chart) can be generated at once (YouTube video upload)
Multiple standard frames' Points & Figures (Secret Chart) can be generated at once (YouTube video upload)
× ![]()