
We have compiled questions and answers about the "Market Forecast Tool"
We will compile questions and answers about the “Market Forecast Tool” on this page.
Before making an inquiry, we would be grateful if you could read this page.
Q. I have never used Points & Figures. Even with no experience, can I effectively use this tool?
A. Most people purchase this tool with zero knowledge of P&F, but after asking me questions and receiving answers, everyone now uses it effectively.
Also, many purchasers use it without ever asking me questions at all.
Creating P&F by oneself is difficult, but the tool takes care of the hard parts automatically.
P&F is a technical analysis method that makes it easy to visually understand a vague, hard-to-grasp market; it is by no means difficult.
Details on specific usage are described in the blog on the “Members-Only Page.”
Q. This tool predicts entry points, exit points, and stop-loss points from the created Points & Figures?
A. That’s right.
The advantages of Points & Figures include:
① Entry signals trigger and exit points are calculated at the same time
② Stop-loss points become clear
③ It becomes easy to grasp the trend
and more.
In particular, the advantage described in ① makes P&F stand out as a superior technical analysis method compared to others.
Q. Specifically, where in the Excel screen should I look for the entry and exit points?
Please provide concrete examples.
A. We will explain using the P&F on the page below as a concrete example.
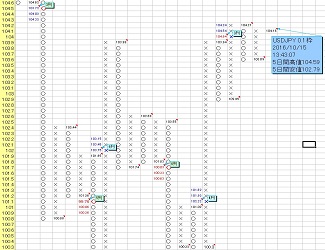
Points & Figures Screen Introduction
In the USD/JPY 0.1-yen grid P&F on the page above, the daily close of 115.28 yen (the value pointed to by the arrow in the comment “USDJPYJPY0.1枠~” in the image above) is above 114.1 yen, so a blue “✖” upward signal lights up.
(the downward signal is shown on the P&F chart as a red “○”)
This is a typical entry point.
Exit point = target (target value).
In the image above, it is displayed with three values: “114.93・115.23・115.53.”
In standard P&F horizontal calculations, the target value is the maximum of the three for upside targets, or the minimum of the three for downside targets.
Sometimes the target value is not reached, so the remaining two are shown as reserves.
Generally, the exit point is the maximum of the three for upside, or the minimum for downside, but if it is not reached, to secure profit early and reliably you should
use a modest target value as the exit point.
Q. What kind of numbers are the base frames?
A. Let me explain using the “USDJPY 0.1-yen frame on a 120-minute chart” below.
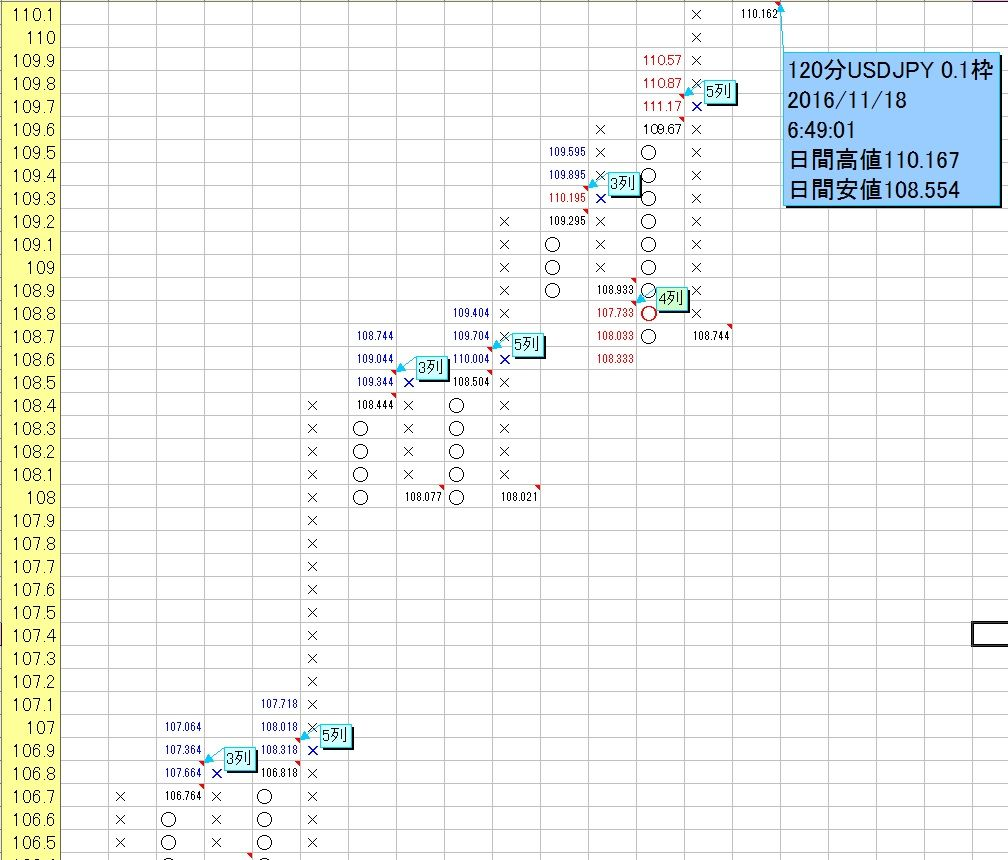
In this case, the base frame is “0.1 yen,” but you can see that the left yellow cells in the P&F are in 0.1-unit steps.
The base frame is the unit that serves as the basis for creating P&F, one frame (cell) like this.
Usually, for daily yen-cross currency pairs, you use values such as “0.05,” “0.1,” or “0.2;” for dollar-cross currency pairs you use “0.0005,” “0.001,” or “0.002,” etc.
In general, the smaller you set the base frame, the higher the target achievement rate, but the profit range at target achievement becomes smaller; conversely, the larger you set it, the lower the achievement rate but the profit range becomes larger.
Also, the longer the time frame, the higher the target-reaching rate for a larger base frame.
In other words, targets calculated with 0.1・0.001・20 frames are more achievable than 0.2・0.002・50 frames.
Q. Where can I find the stop-loss value?
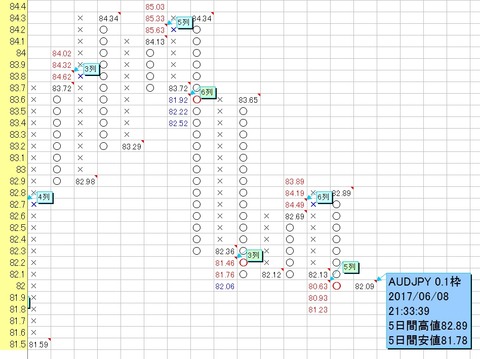
A. Let me explain in detail using the AUD/JPY daily chart with a 0.1-yen frame below.
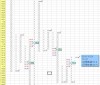
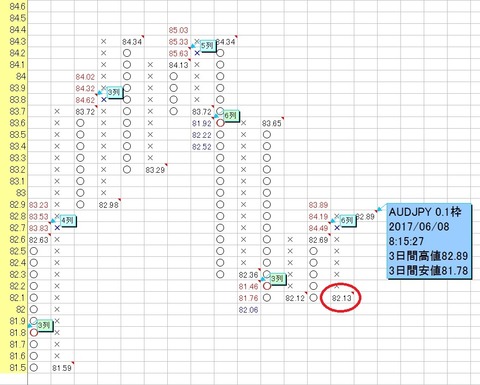
As shown in the first image, an upward signal (long) is currently generated, but if the daily close falls below 82.1 yen (for example, 82.09 yen), a downward signal (short) will be generated as shown in the second image below.
The line at 82.1 yen serves as a guide for stop-loss.
Also, at the moment an upward signal (long) is generated, around the value circled in red in the third image, around “82.13 yen,” is the stop-loss line.
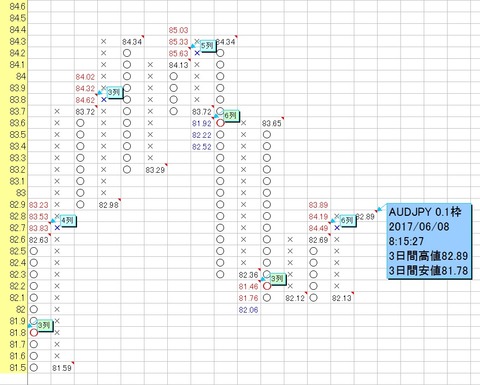
Image ②
Q. In the P&F screen, what does it mean when three targets (values) are displayed?
A. In standard P&F horizontal calculations, the target value is the maximum of the three for upside, or the minimum of the three for downside.
Sometimes the target value is not reached, so the remaining two are shown as reserves.
Generally, the exit point is the maximum of the three for upside or the minimum for downside, but if it is not reached, when you want to realize profits early and reliably, it is better to use a modest target value as the exit point.
Q. When I run the program, I get “Runtime Error '1004': 'Market Forecast Tool.xls' could not be found.”
A. This error message appears because
the tool file name has changed from “Market Forecast Tool.xls,” so
please check that the tool file name you are using exactly matches “Market Forecast Tool.xls” (no extra spaces, etc.).
Q. There is no currency rate movement like the ones uploaded to YouTube.
A. 【With setting procedure video available】 MT4 (MetaTrader 4) can now link (synchronize)
as described in step ①,
Launch MT4 and in the top menu select [Tools] → [Options] → in the [Server] tab check [Enable DDE server].
After enabling, close MT4 and Excel, then
launch MT4 first, ensure MT4 is fully up, then start Excel, and repeat this a few times.
Q. Does this system display a stop-loss guideline?
A. In typical P&F-based trading, the rule is to cut losses or take a position in the opposite direction if a signal contrary to the predicted direction on the daily P&F chart occurs.
For this case, the base frame for yen pairs is usually “0.1 yen,” and for dollar pairs it is usually “0.001.”
If you want to decide stop-loss sooner, you can use a smaller base frame such as “0.05 yen” for yen pairs or “0.0005” for dollar pairs, or use Invast data and on 8/4/2-hour timeframes, if a signal opposite to the predicted direction occurs, use that as a stop-loss or take a position in the opposite direction.