
Consider the employment statistics after that
Good morning
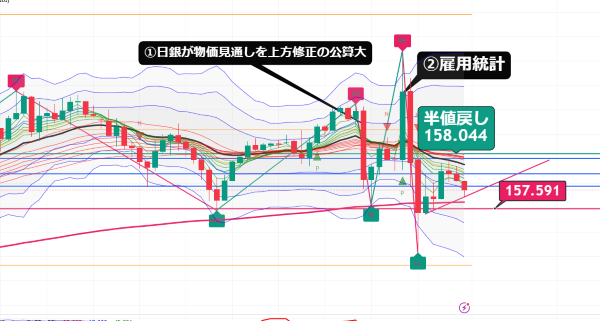
This is the USD/JPY 1-hour chart
Friday dropped sharply due to report ①
If it enters the 158 range, it is evidence that intervention is being watched closely
The U.S. employment data in ② exceeded expectations and unemployment rate declined,
which supports the argument for pausing rate cuts,
and it surged, but then fell sharply in front of the 159 range
In the end, it became a range between pivot R2 and S2.
In Friday's broadcast
Tonight's employment statistics strategy
If it rises, we will target shorts on Monday (weekend review)
If it falls, we will target longs (around 157; if possible 156.5)
was the plan
I thought that at the start of the week intervention would be on the mind and it would be sold
but
it was sold immediately, wasn't it~
I was looking at profit-taking declines, so the short was entered as a scalp
I could anticipate the movement, but…
If that happens, is the pullback around 156.5?
Surely from the employment data result it won’t go this far, right?
I think so
Depends on the movement at the start of the week
Many think the decline is due to U.S. stock declines, but
Since intervention is highly anticipated at the start of the week
I wonder if there will be moves to unwind long positions?
Whether you view it as a decline that retraces halfway back up and then falls,
or as a short-term rise pullback, is where opinion splits
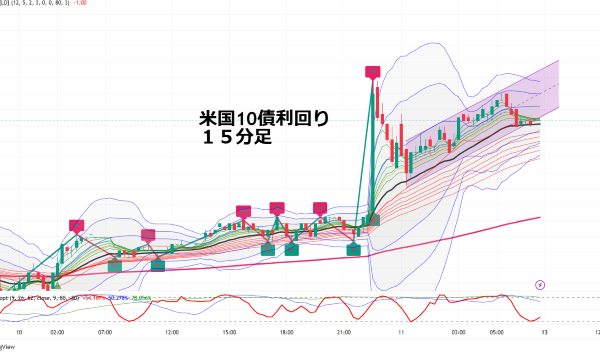
U.S. bond yields are in an upward trend on a 15-minute chart,
but they are breaking below the lower bound of the channel
× ![]()