

【BTCJPY】20181120 Daily Pivot
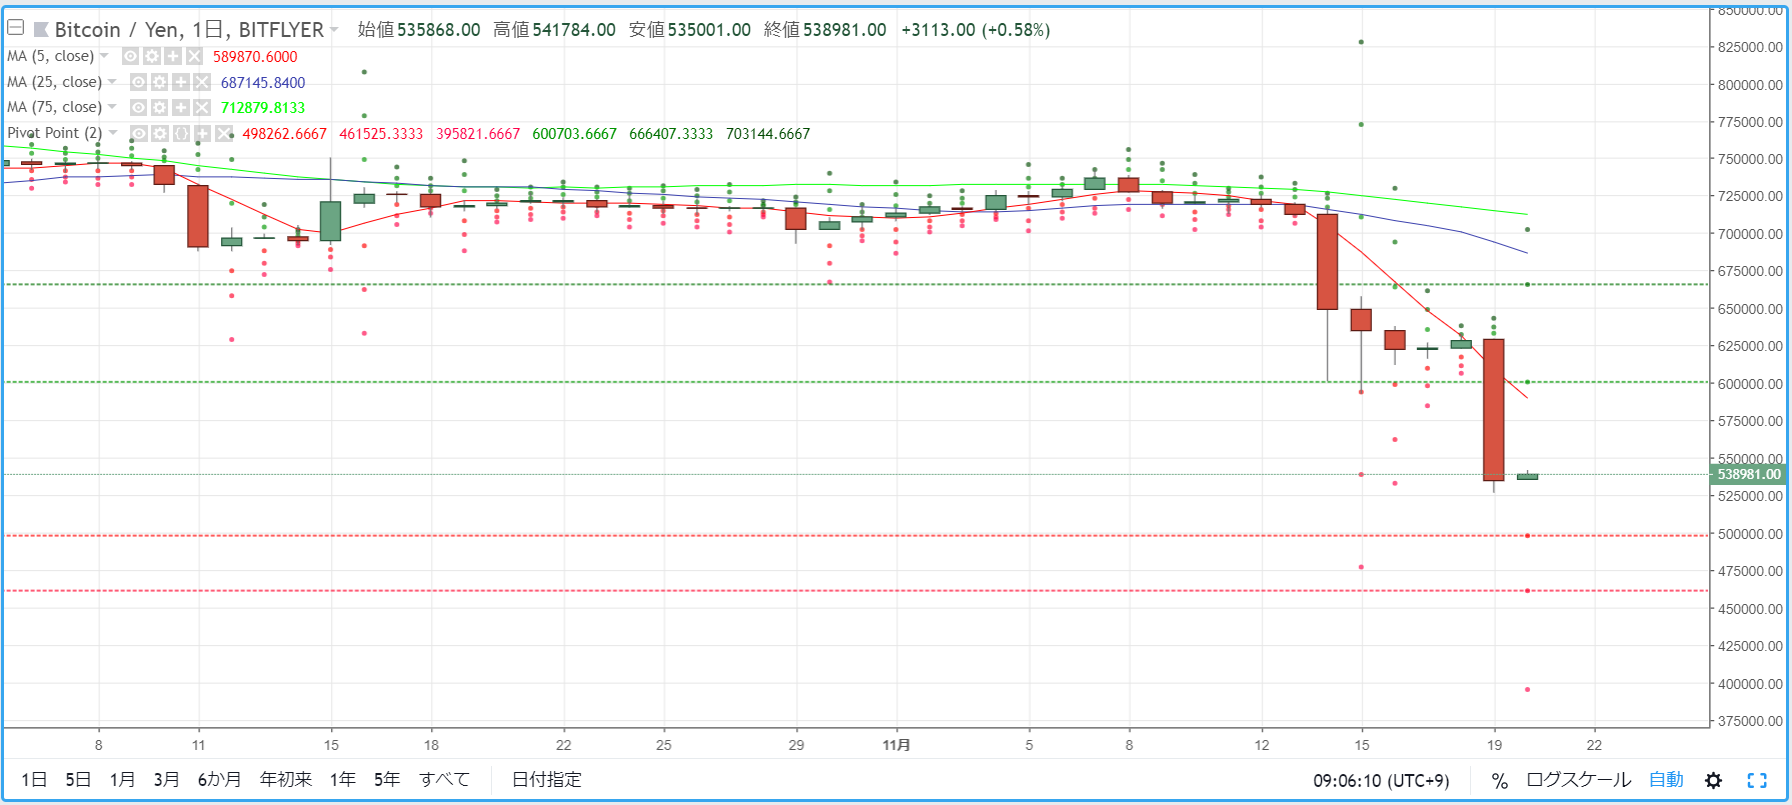
As a guideline for day trading BTCJPY, we will check the pivot. Yesterday (November 19), the price started to fall in the early afternoon and quickly fell below 600,000 yen, dropping to the mid-520,000 yen range at one point. The market environment updated its year-to-date low and formed a long bearish candle.
R2=666,407
R1=600,703
S1=498,262
S2=461,525
※ A pivot is a technical indicator that forecasts the price movement for the day based on the previous day's movements. Centered on the Pivot Point (PP), lines of resistance (R1, R2) and support (S1, S2) are drawn above and below, and they are used as trading reference points.
【Calculation】
Pivot Point (PP) = (Previous day's close + previous day's high + previous day's low) / 3
Resistance Line 1 (R1) = PP + (PP - previous day's low)
Support Line 1 (S1) = PP - (previous day's high - PP)
Resistance Line 2 (R2) = PP + (previous day's high - previous day's low)
Support Line 2 (S2) = PP - (previous day's high - previous day's low)


