Would you like to visualize trends? We support trades that are robust against deception and noise!
Are you troubled by deception and noise?
Several technical indicators can be used for trend judgment, but displaying many and jumping between the chart screen and the oscillator screen is tedious.
If you neglect this, it can become a big problem! We support such trend judgments.
Trend Eye uses moving averages, Bollinger Bands, RSI, and Stochastics to display trends.
How to use is simply to set each parameter. Of course, the default state is OK. First, take a look at the display screen.
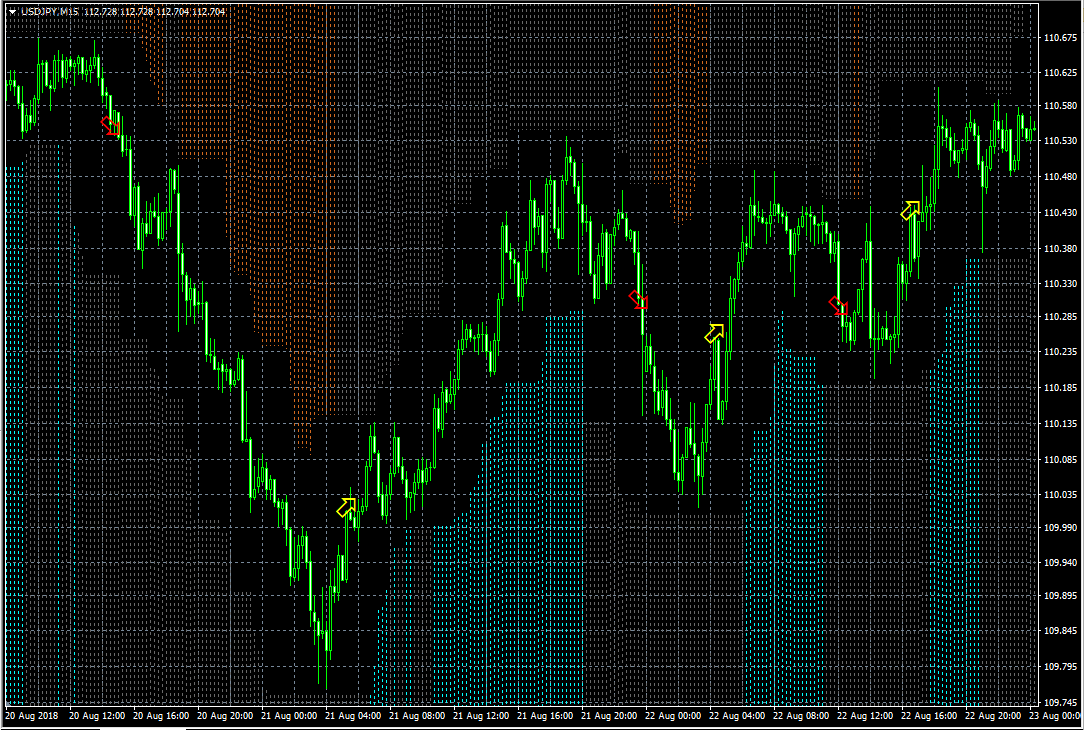
Blue areas indicate an uptrend, red areas indicate a downtrend.
An upward push and downward pull illustrate the trend.
Feel free to use the main area as you like. It won’t interfere with other indicators!
We will display signals when switching the span model.
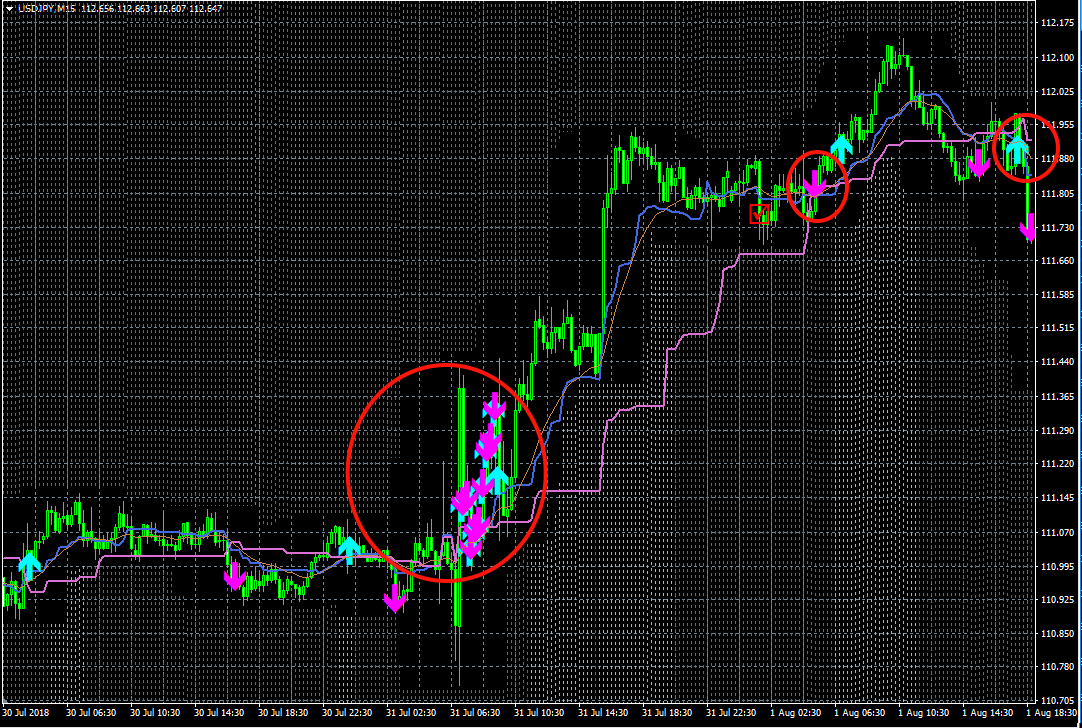
You can avoid deceptive noise with red circles. Look at the direction of the signal and place orders at the timing of the trend to achieve high-probability trades.
Next, we will display signals from the Kaufman adaptive moving average.
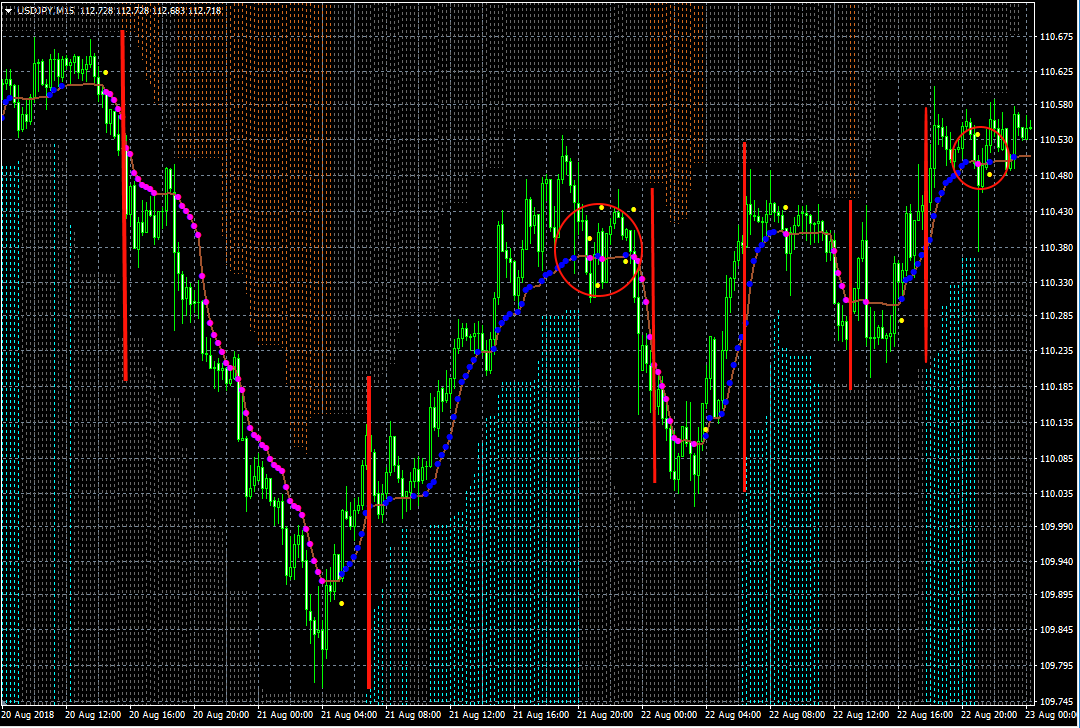
By avoiding deceptive noise in red circles and ordering at the timing of the red line (slightly delayed from the signal), high-probability trades become possible.
Settings Parameters
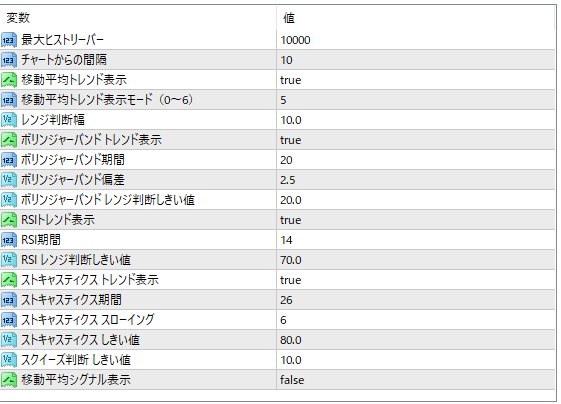
Maximum historical bars: number of bars to display
Interval from chart: how far to separate the cloud (histogram) display from the candlesticks
Moving average trend display: display trend with Kaufman adaptive moving average?
Moving average trend display mode (0–6): moving average mode (larger values mean slower judgment)
Range judgment width: the upper and lower width of the moving average for range judgment
Bollinger Bands Trend Display: display trend based on the Bollinger Bands base line fluctuation value?
Bollinger Bands period: Bollinger Bands period
Bollinger Bands Deviation: Bollinger Bands deviation
Bollinger Bands Range Judgment Threshold: threshold for the base line fluctuation value used for range judgment
RSI Trend Display: display trend using RSI?
RSI Period: RSI period
RSI Range Judgment Threshold: RSI range judgment threshold
Stochastic Trend Display: display trend using Stochastic?
Stochastic Period: Stochastic period
Stochastic Slow: Stochastic slowing
Stochastic Threshold: Stochastic range judgment threshold
Squeeze Judgment Threshold: HIGH/LOW fluctuation range judgment threshold
Moving Average Signal Display: display Kaufman adaptive moving average signals?
The moving average judgment is hard to understand, so we explain with an image.
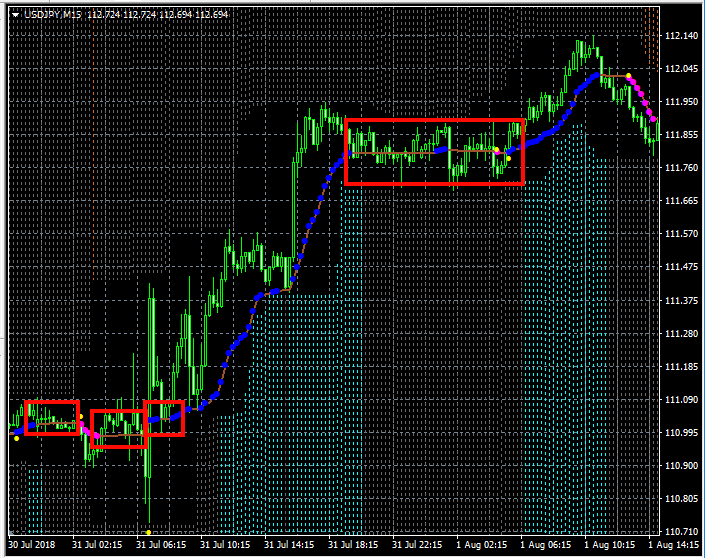
Areas boxed in that show little movement of the moving average (do not reach the range judgment width) are considered range-bound.
About Me
This is my first listing. I am Papeta.
I used to run FX manually, so I bought an automated trading software, but I decided to make my own! I’m taking on EA creation with determination.
“Papeta” is puppeteer. I named it that because I want to control FX by manipulating an EA (automatic puppet).
That said, an EA with a consistently rising equity curve is quite difficult.
For EA testing, I try various technical indicators as indicators.
Even good indicators, when turned into EA, can end up with a good-looking but ineffective style, yet when used manually, they can be quite useful.
I plan to provide such indicators.