

【BTCJPY】20181116 Daily Pivot
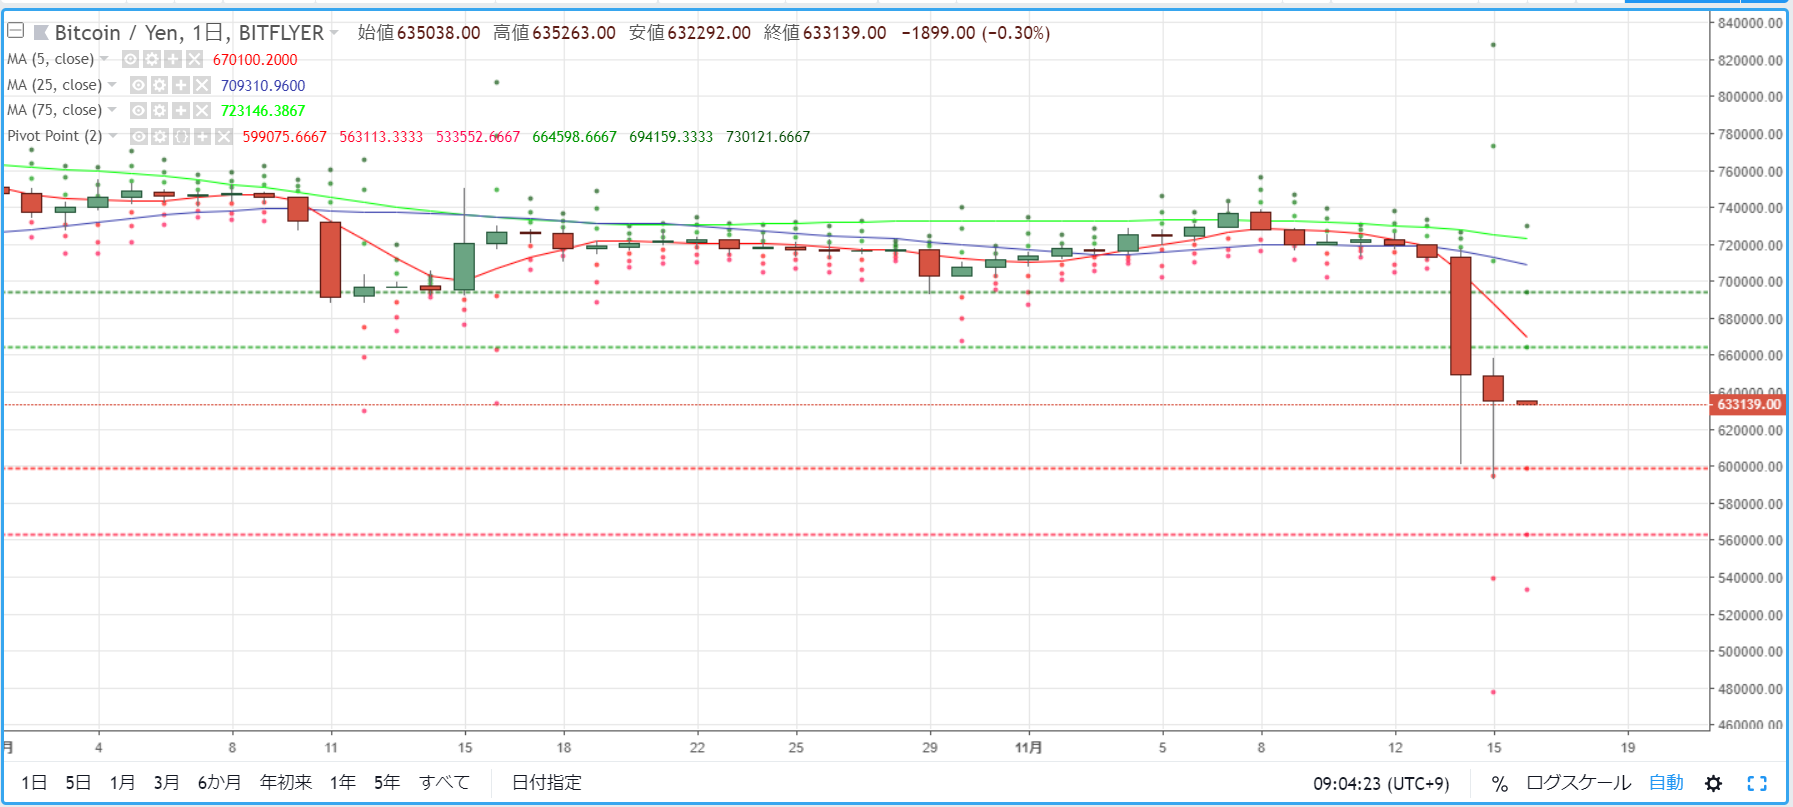
As a guideline for day trading BTCJPY, we check pivot points. Yesterday (November 15) also showed strong selling pressure, briefly recording a low that fell below 600,000 yen. It then recovered to the 630,000-yen range, but the market closed with a bearish candle.
R2=694,159
R1=664,598
S1=599,075
S2=563,113
※ A pivot point is a technical indicator used to forecast the potential price movement for the day based on the previous day's price action. Centered on the Pivot Point (PP), draw resistance lines (R1, R2) above and below, and support lines (S1, S2) to use as trading references.
【Formula】
Pivot Point (PP) = (Previous day's close + high + low) / 3
Resistance Line 1 (R1) = PP + (PP - previous day's low)
Support Line 1 (S1) = PP - (previous day's high - PP)
Resistance Line 2 (R2) = PP + (previous day's high - previous day's low)
Support Line 2 (S2) = PP - (previous day's high - previous day's low)


