The Road to Investment Victory (Part 158)
The Way of Investing (that158)
Annual Year-End Special
Year-End Special: If We Traded on the Daily Chart
1. Look at Currency Strength on the Daily Chart
Let’s take a look at a year of daily currency strength charts.
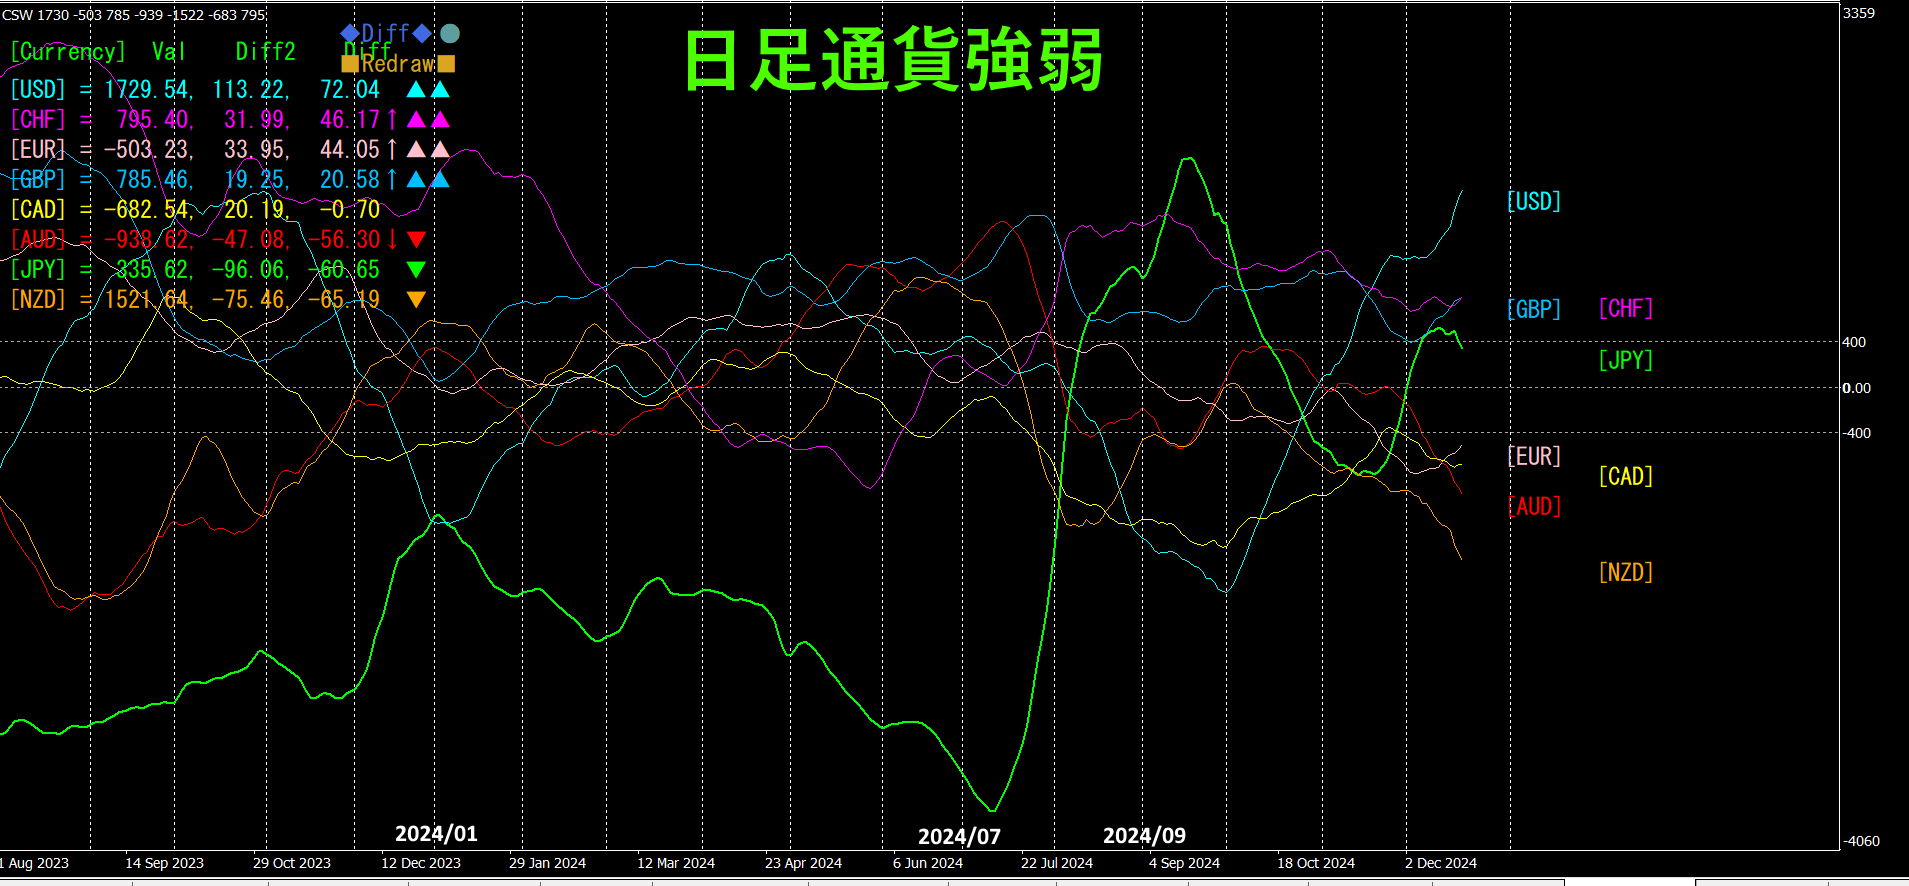
Compared with other currencies,JPY shows large fluctuations up and down.From2024 year1 month to7 month, the currency weakened on its own, and perhaps due to that rebound, from July to September it exhibited an unusual behavior, jumping from a bottom to the strongest currency.
This fluctuation is thought to involve various fundamental factors, but this time we will analyze using only the chart. (It would be interesting to compare with other indices such as the Nikkei average or long-term government bond futures, but we will omit that for now.)
2.Search for currencies that are in a reverse correlation
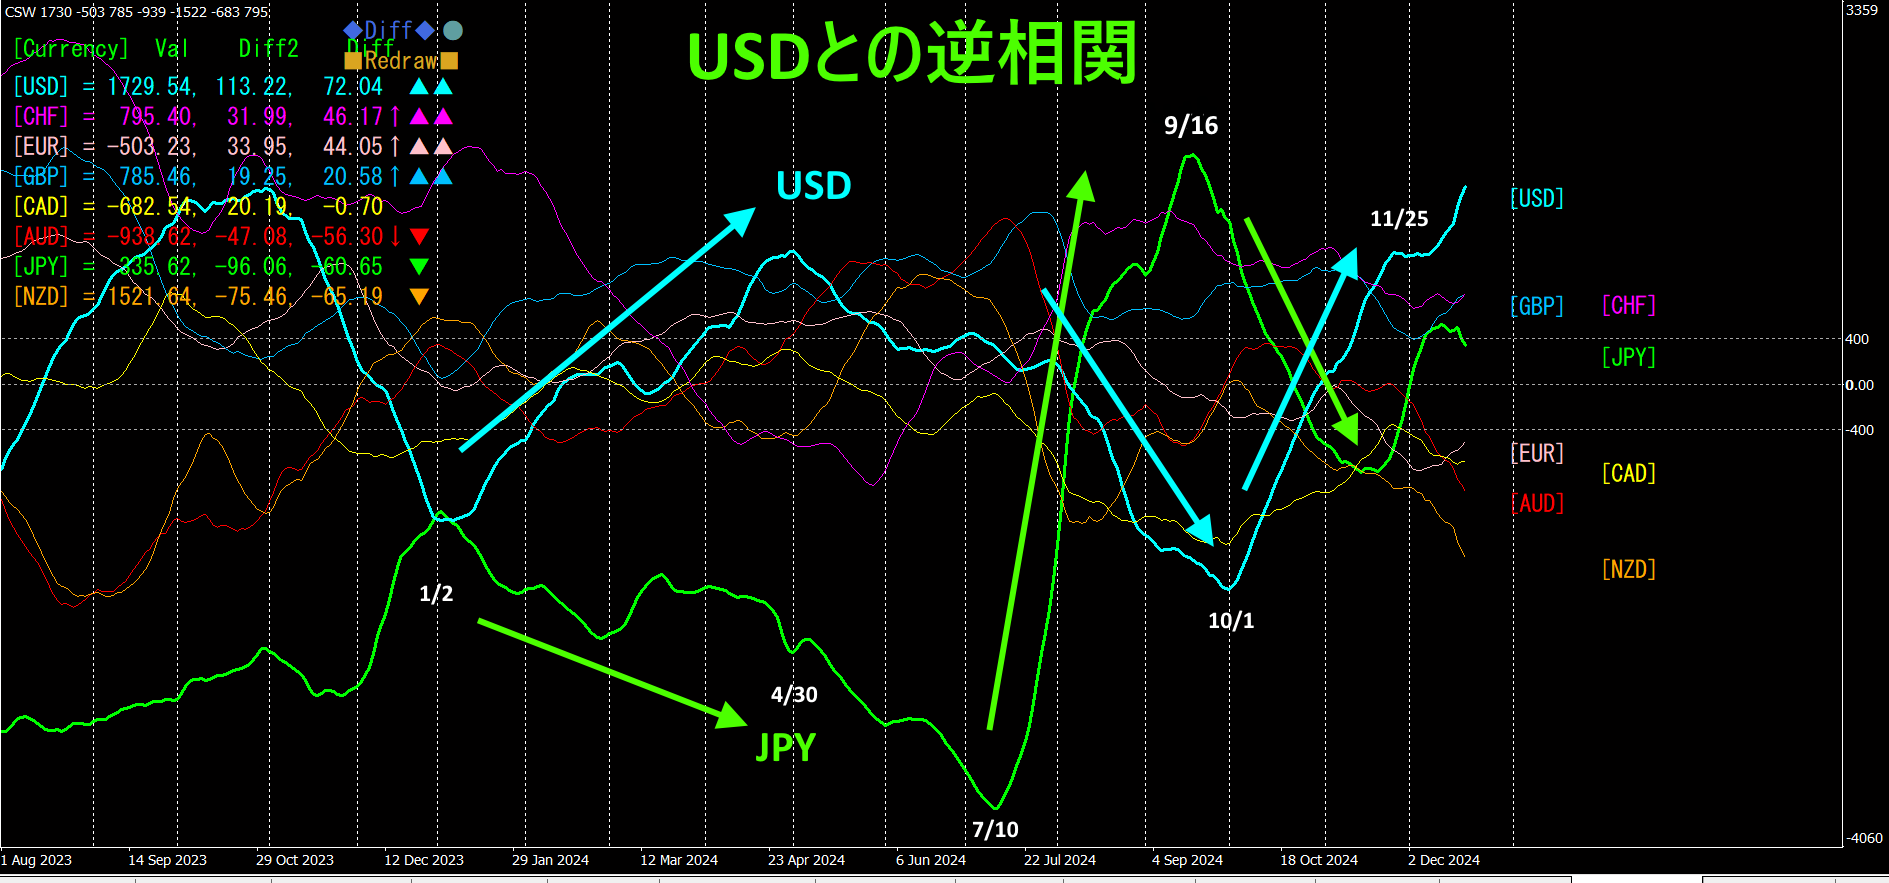
From the above chart,
① 1/2~4/30 USDJPY Trading long
②7/10~9/16 USDJPY Trading short
③10/1~11/25 USDJPY Trading long
These are just three trades for the year.
So, how manypips were gained? A rough end-of-day close estimate is shown.
①
141.966 157.781 1581.5pips
②
161.663 140.596 2106.7pips
③
143.540 154.176 1063.6pips
Total4751.8pips
In just three trades for the year,4700pips of profit (at 1 lot,¥470 million profit) was earned.
3. What if the pair wereAUD?
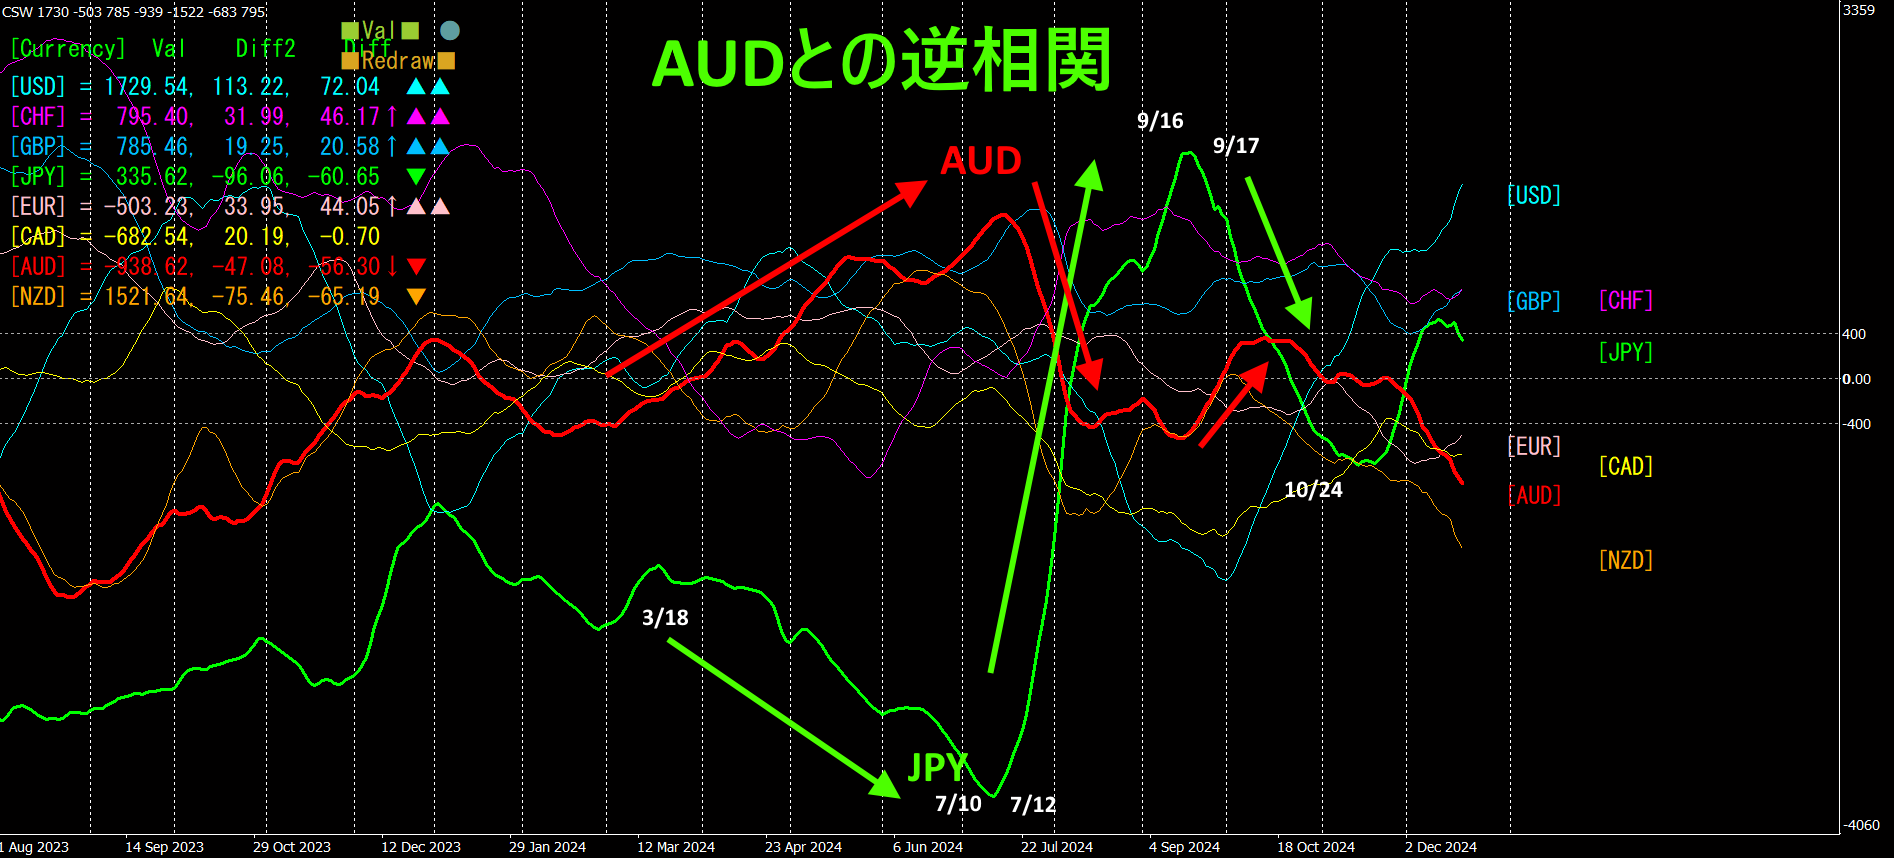
From the above chart,
①3/18~7/10 AUDJPY Trading long
②7/12~9/16 AUDJPY
Trading short③9/17~10/25 AUDJPY Trading long
These are also three trades for the year.
So, how manypips were gained? A rough end-of-day close estimate is shown.
①
97.420 109.053 1163.3pips
②
107.074 94.915 1215.9pips
③
96.183 100.792 460.9pips
Total2840.1pips
In just three trades for the year,2800pips of profit (at 1 lot,¥280 million profit) was earned.
USDJPY andAUDJPY trading as a two-currency pair would yield a total of7500pips, and even after a 20% tax, you could realize an annual income of¥600 ten million from FX alone by trading on the daily chart.
4. Using the Ultimate Inverse-Correlation Indicator
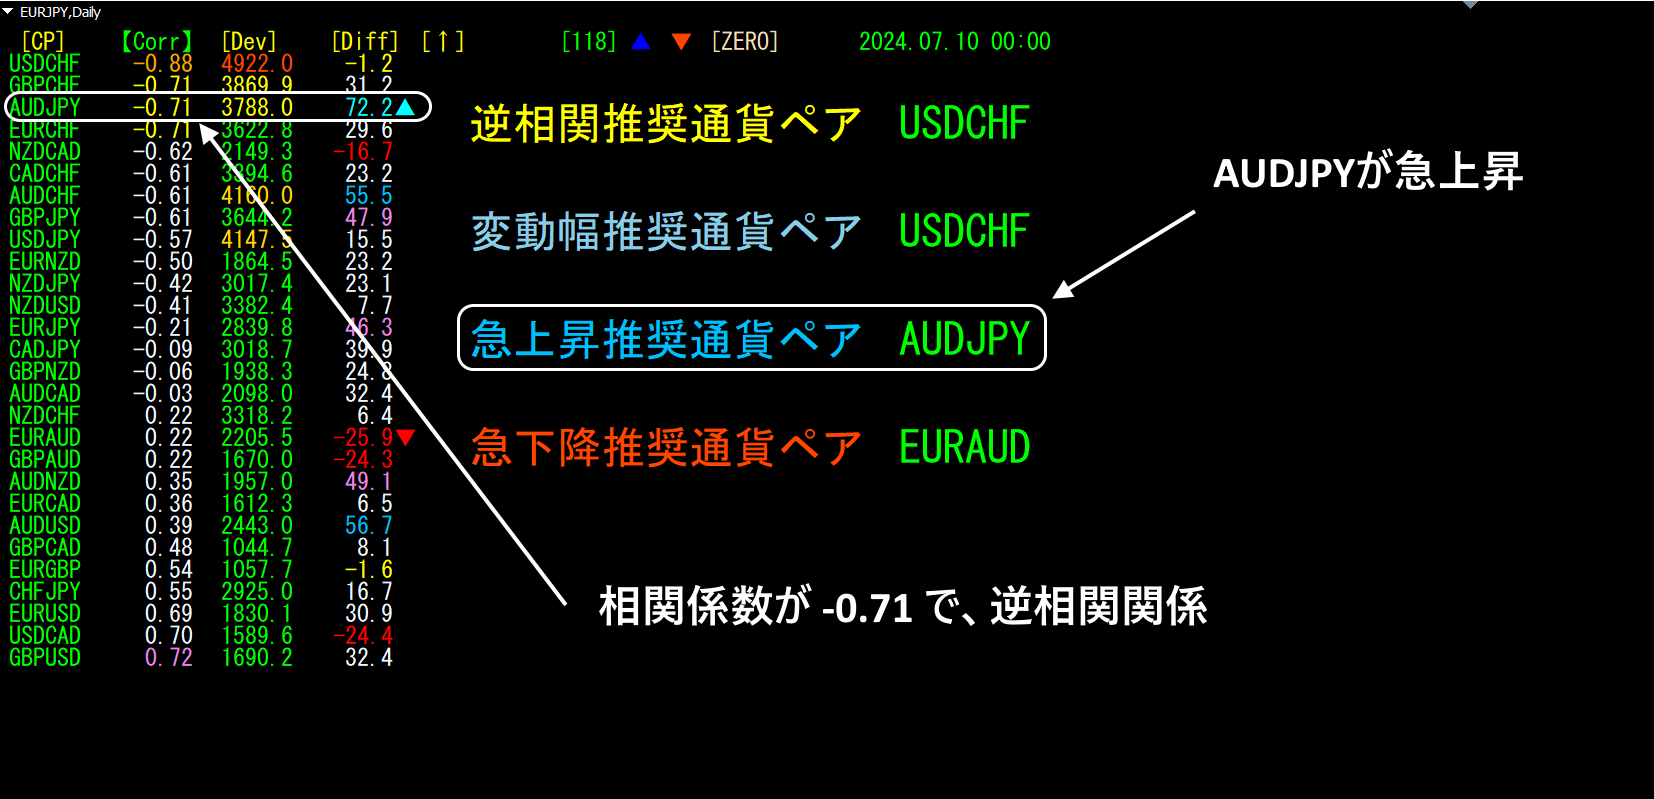
Going back to the date of2024 year7 month10 day,“Ultimate Inverse-Correlation Indicator” is applied.
AUDJPY has a correlation coefficient of-0.71 and is in a reverse-correlation relationship, and it is rising rapidly on daily charts, soAUDJPY market conditions.
Similarly, going back to2024 year10 month10 day,“Ultimate Inverse-Correlation Indicator” has been used.
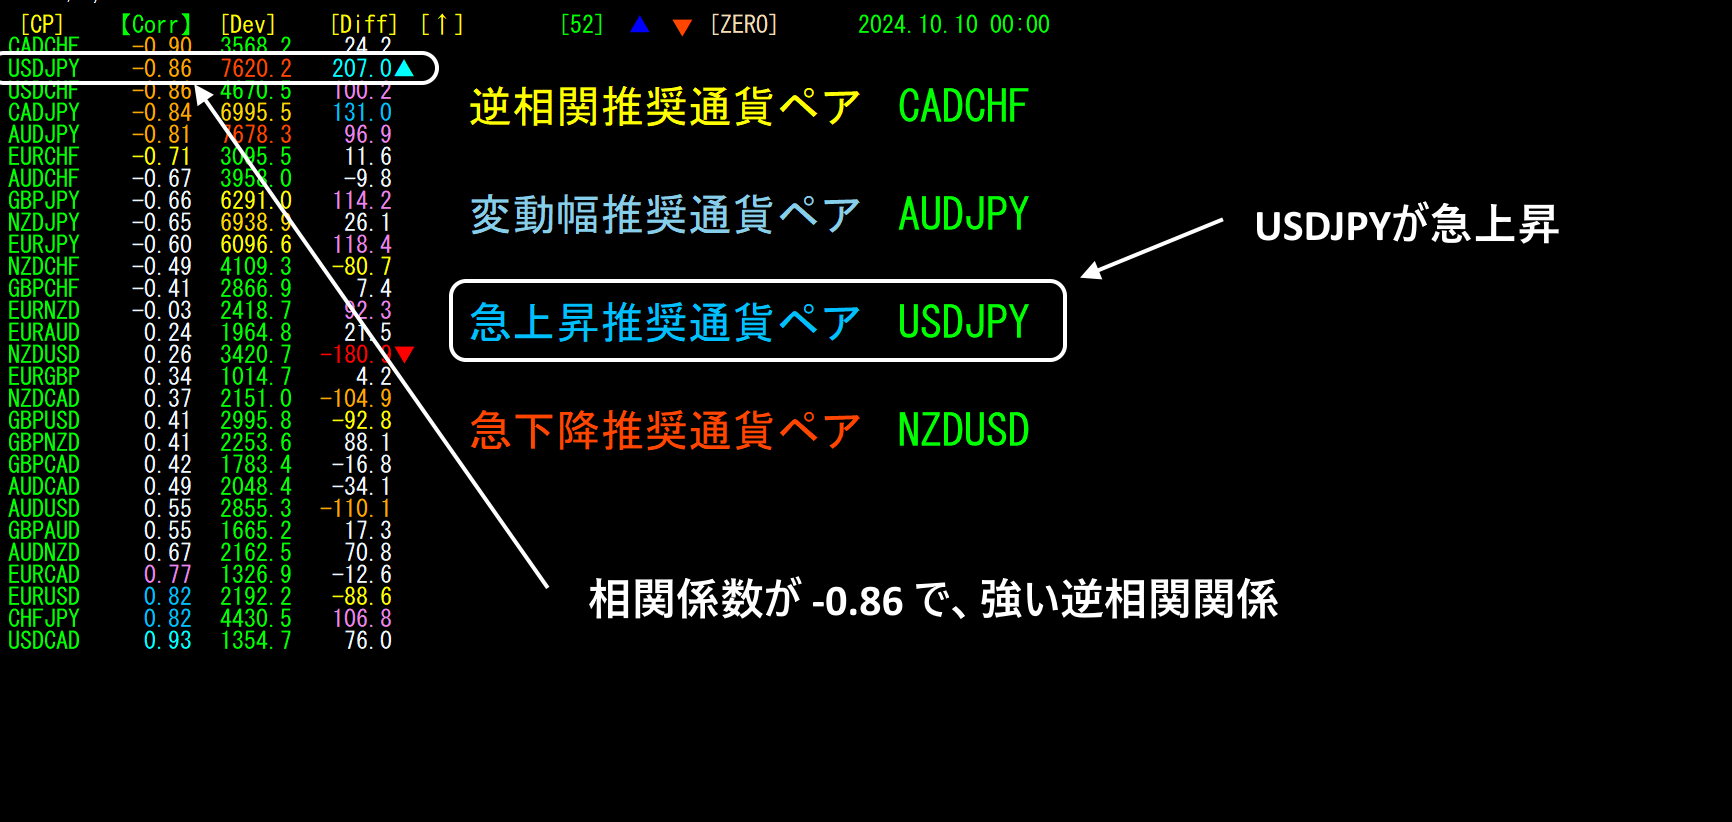
USDJPY has a correlation coefficient of-0.86 and is rising rapidly on daily charts, soUSDJPY looks favorable for buying market conditions.
5. Look at correlations among national currencies
Inverse correlations of currency strengthoffer another interesting perspective when viewed as correlations of currency strength.
(1)CHF and