

Dollar-Yen Buy Strategy! ~ Bold Forecast for USD/JPY within the Year ~
◎Strategy and Outlook
Dollar-Yen BuyStrategy (Waiting)
Dollar-Yen in a narrow range or an uptrend!
Time it and execute buy rotation
◎ Dollar-Yen Buy Factors
・Year-end dollar demand
Year-end is said to require US dollars for profit-taking and settlement by real demand players, making US dollar buying more likely.
・Strength of the US economy
From the economic indicators, the US economy is not just doing well but heating up.
・Widening US-Japan long-term interest rate gap
Japan's long-term rates hover around 0.15% due to accommodative policy. US long-term rates have risen above 3.0% due to repeated rate hikes. If rate hikes continue, the interest rate gap will widen further.
*See documents ①② below
・Rise of the dollar index
The dollar index, which indexes the dollar, continues to rise. The dollar index has broken a key level and surpassed the high from more than a year and a half ago.
*See document ③
・Few buy factors in other currencies
Due to European concerns, pounds and euros are not being bought. With oil prices falling, Canadian dollars aren’t bought. The yen and francs, under easing policy, aren’t bought either. If that is the case, only commodity currencies or the US dollar can be bought.
・Oil price decline
Global demand declines due to the Chinese economy and other global economic slowdowns. With the push for eco-cars (hybrid, electric), gasoline demand decreases. As oil demand globally decreases, production cuts are slow and supply grows per IEA reports. Fall in oil prices is a tailwind for the US economy. In the US, as a car-rich economy, gasoline prices are large. Hence, a drop in fuel prices reduces costs such as factory fuel and electricity costs.
*See document ⑧
・Decline in US and Japanese stock prices
The Nikkei Average is heavy, forming a double top. Recently there was negative growth. The central bank’s easing support, which had been propping up stocks, is at its limit. From here, lack of catalysts to push higher.
*See documents ④⑤
The Dow Average rose to record highs but formed a double top. With the US-China trade and tariff war, corporate earnings forecasts were revised downward. Stock prices fell sharply.
*See documents ⑥⑦
・Decline in oil prices
Reasons for the decline in oil prices are referenced above. The United States is the world’s top oil producer by domestic production. Moreover, excavation costs are higher than those in the Middle East. Therefore, a drop in crude prices hurts oil-related companies and affects stock prices.
*See document ⑧
・BOJ stealth tapering
The BOJ denies it, but the annual target for easing policy has not been reached. Therefore, stealth (under the surface) tapering (end of easing) is being talked about. In any case, the yen, which is already bought for risk-off, could be bought merely on rumors of tapering.
◎ Future Outlook
・Intra-yearrangeto the start of the new yeardownward image
・Break the intra-year rangeand aim for 118 yento rise
The above are two scenarios.
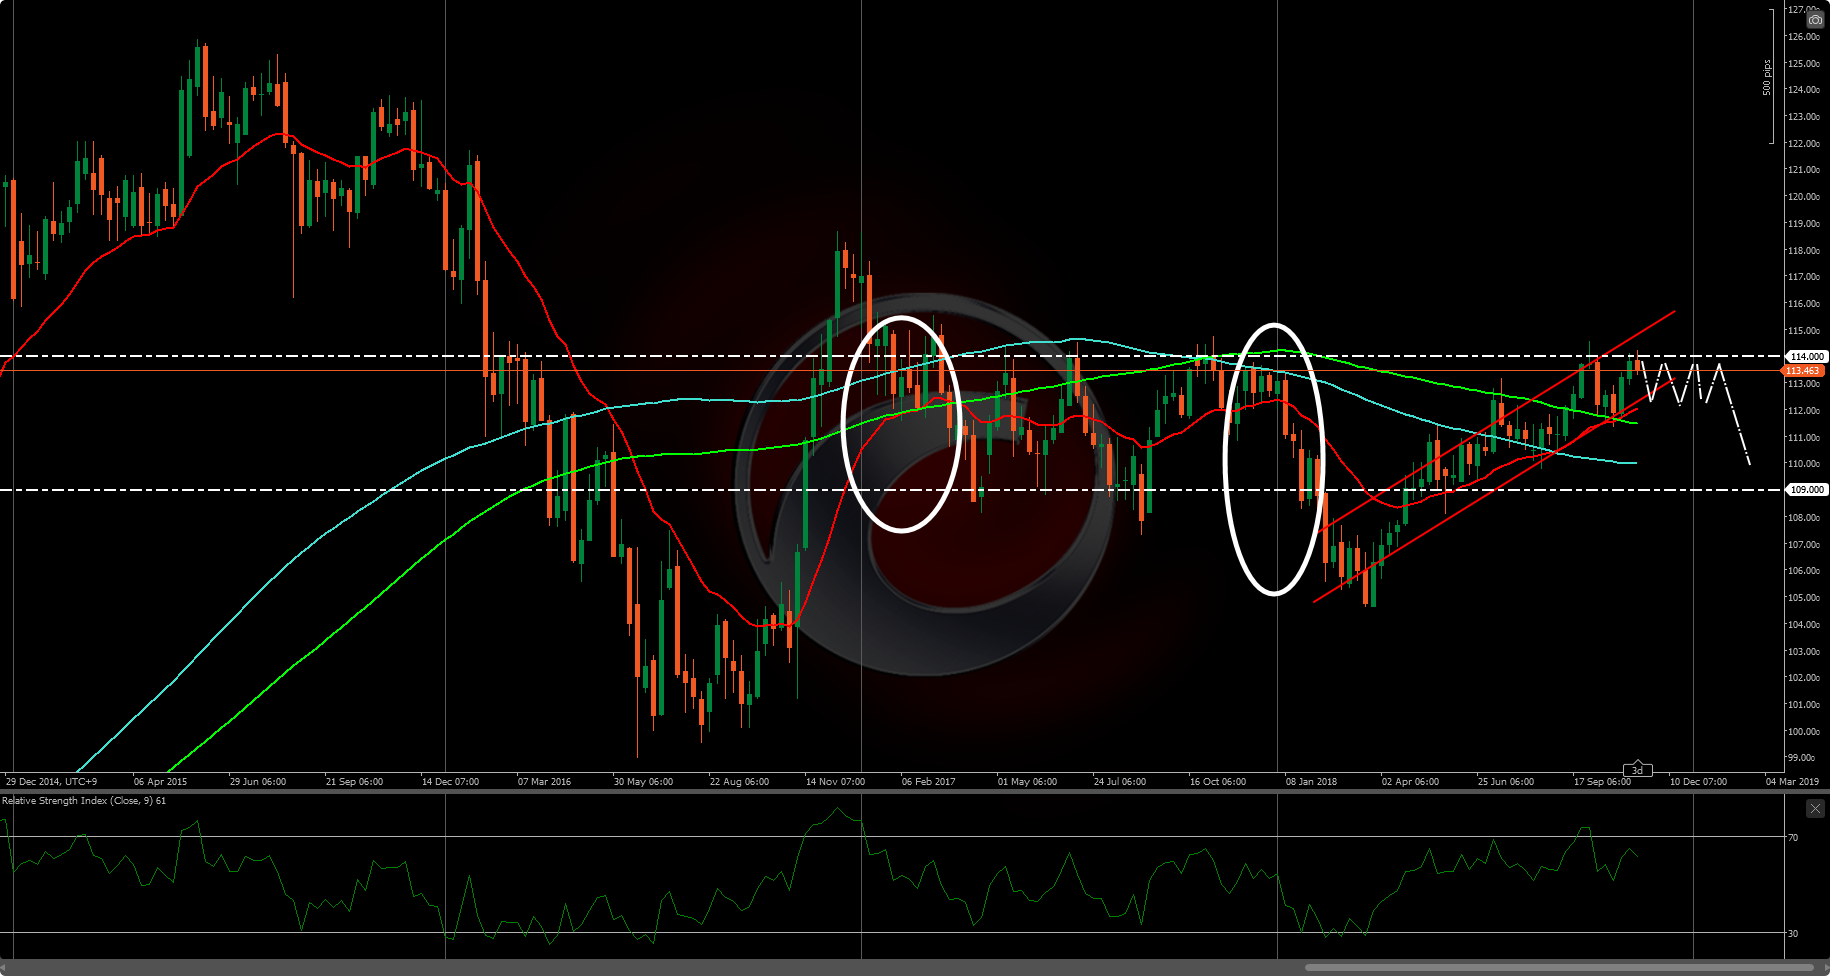
USD/JPY Weekly Chart (range after this year, decline next year)
・Intra-yearrangeto the start of the new yeardownward image
After Trump’s inauguration, it fell from January. Since then, prices remained heavy in a narrow range. As year-end approached, it rose into a range, then from the start of the year it declined.
This year has also risen toward the end of the year. Therefore, given the factors above, it is unlikely to fall, so during the year it remains in a range. Afterwards, around the new year, it may fail to break out of the range and fall back—that is the expected image.
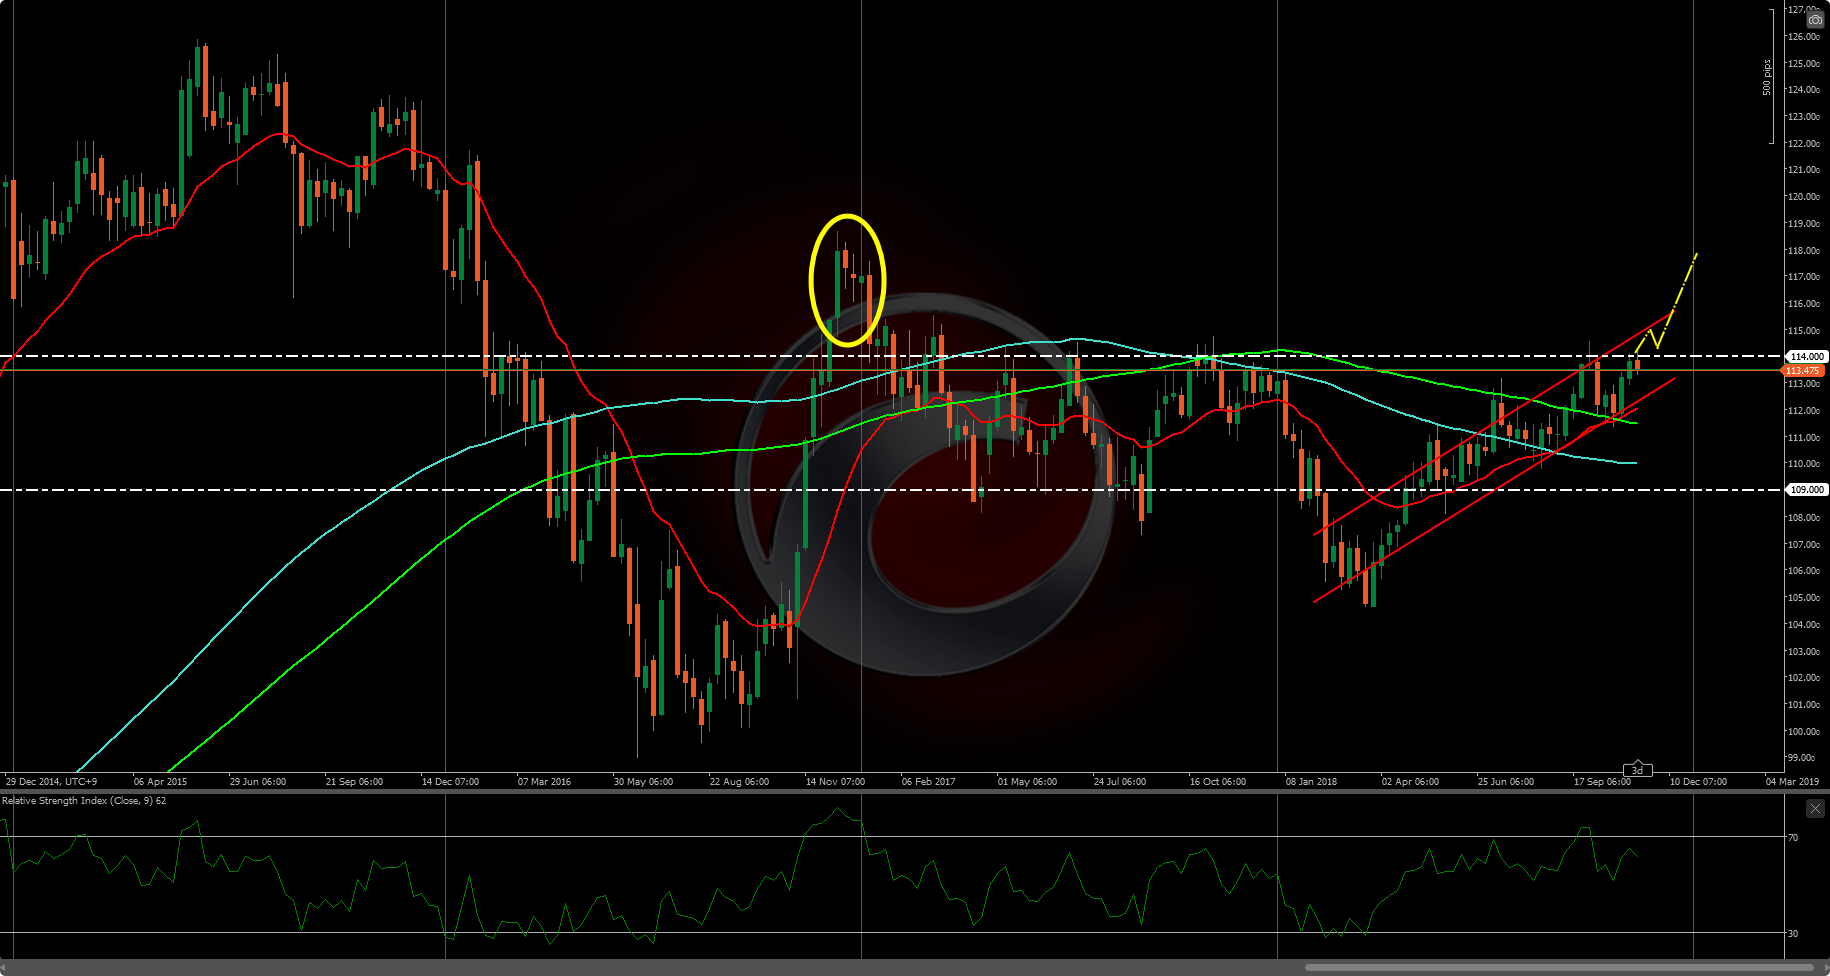
USD/JPY Weekly Chart (range break, aiming for 118 yen)
・Within the yearbreak the rangeand aim for 118 yen
From Trump’s inauguration, it rose to 118 yen. Last year moved in a narrow range, but this year fell sharply and then rose. The ascent since then has been within a parallel channel. If this momentum remains strong, it may break 114 yen and continue to rise to 118 yen. However, the dollar-buying factors remain until the end of this year; next year, the situation needs to be reassessed. If left as is, there is a possibility of dollar-yen declines from the start of the year, so if it cannot rise to about 115 yen within this year, the above range-break-and-fall scenario becomes stronger.
◎ Resources
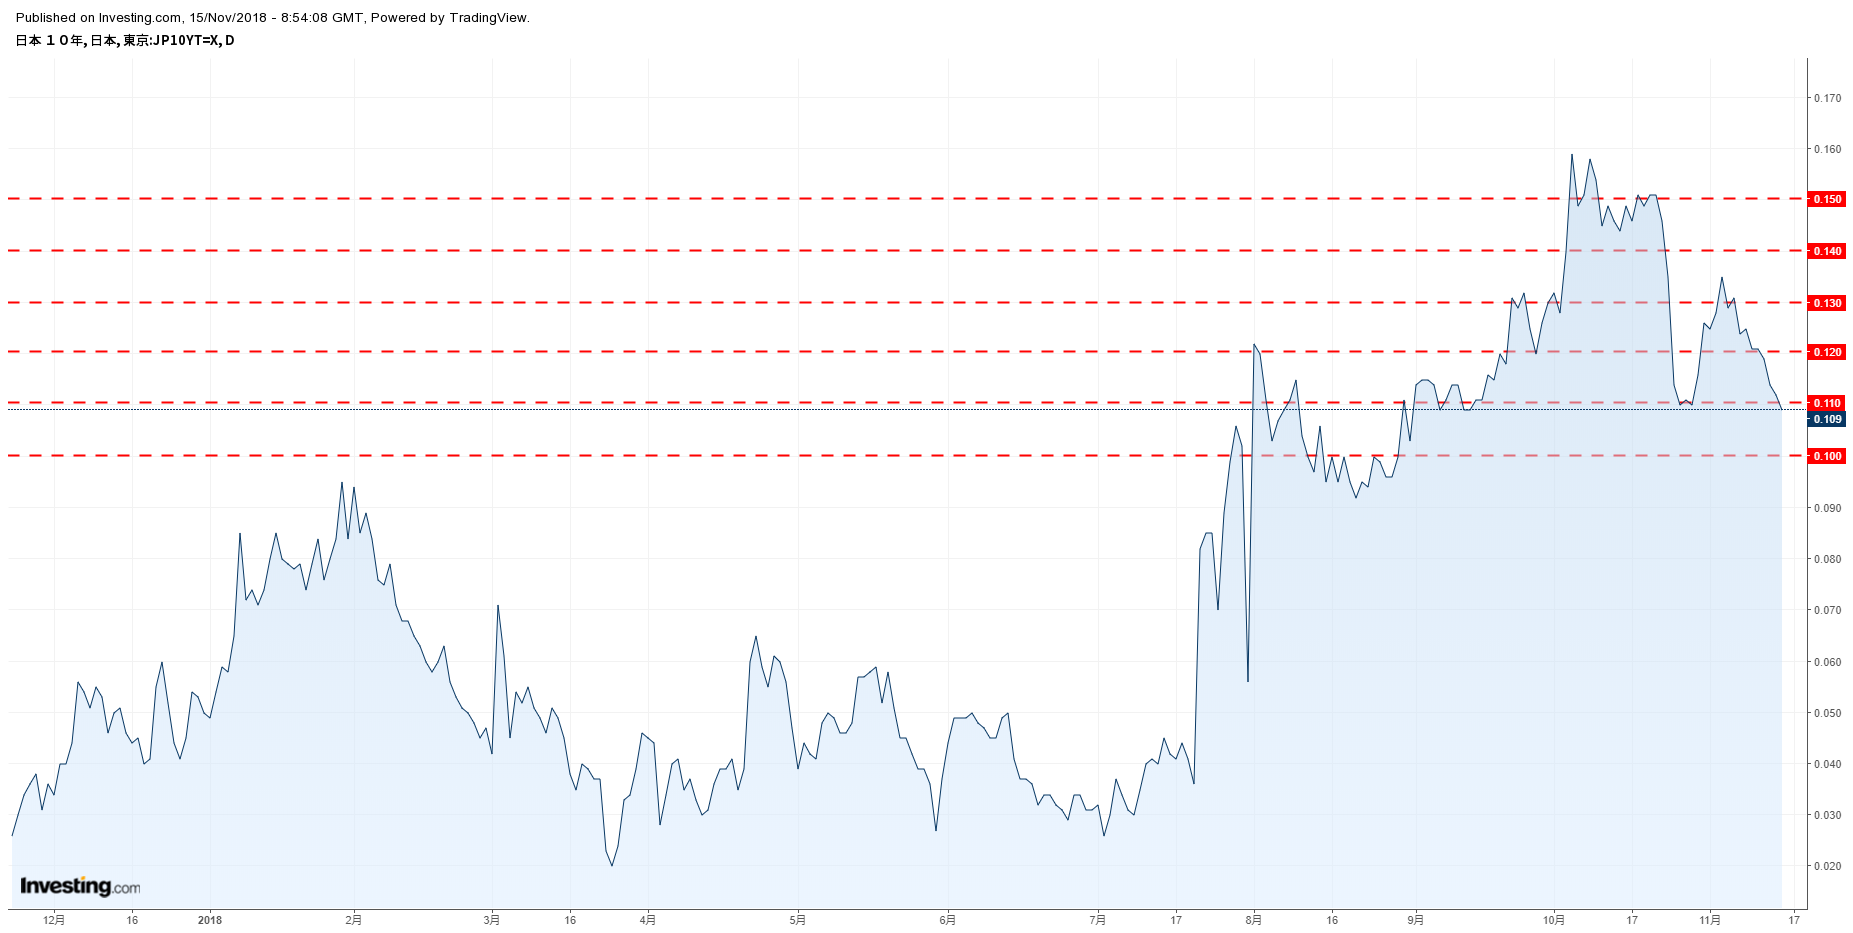
Document ①: US 10-year Treasury yield chart
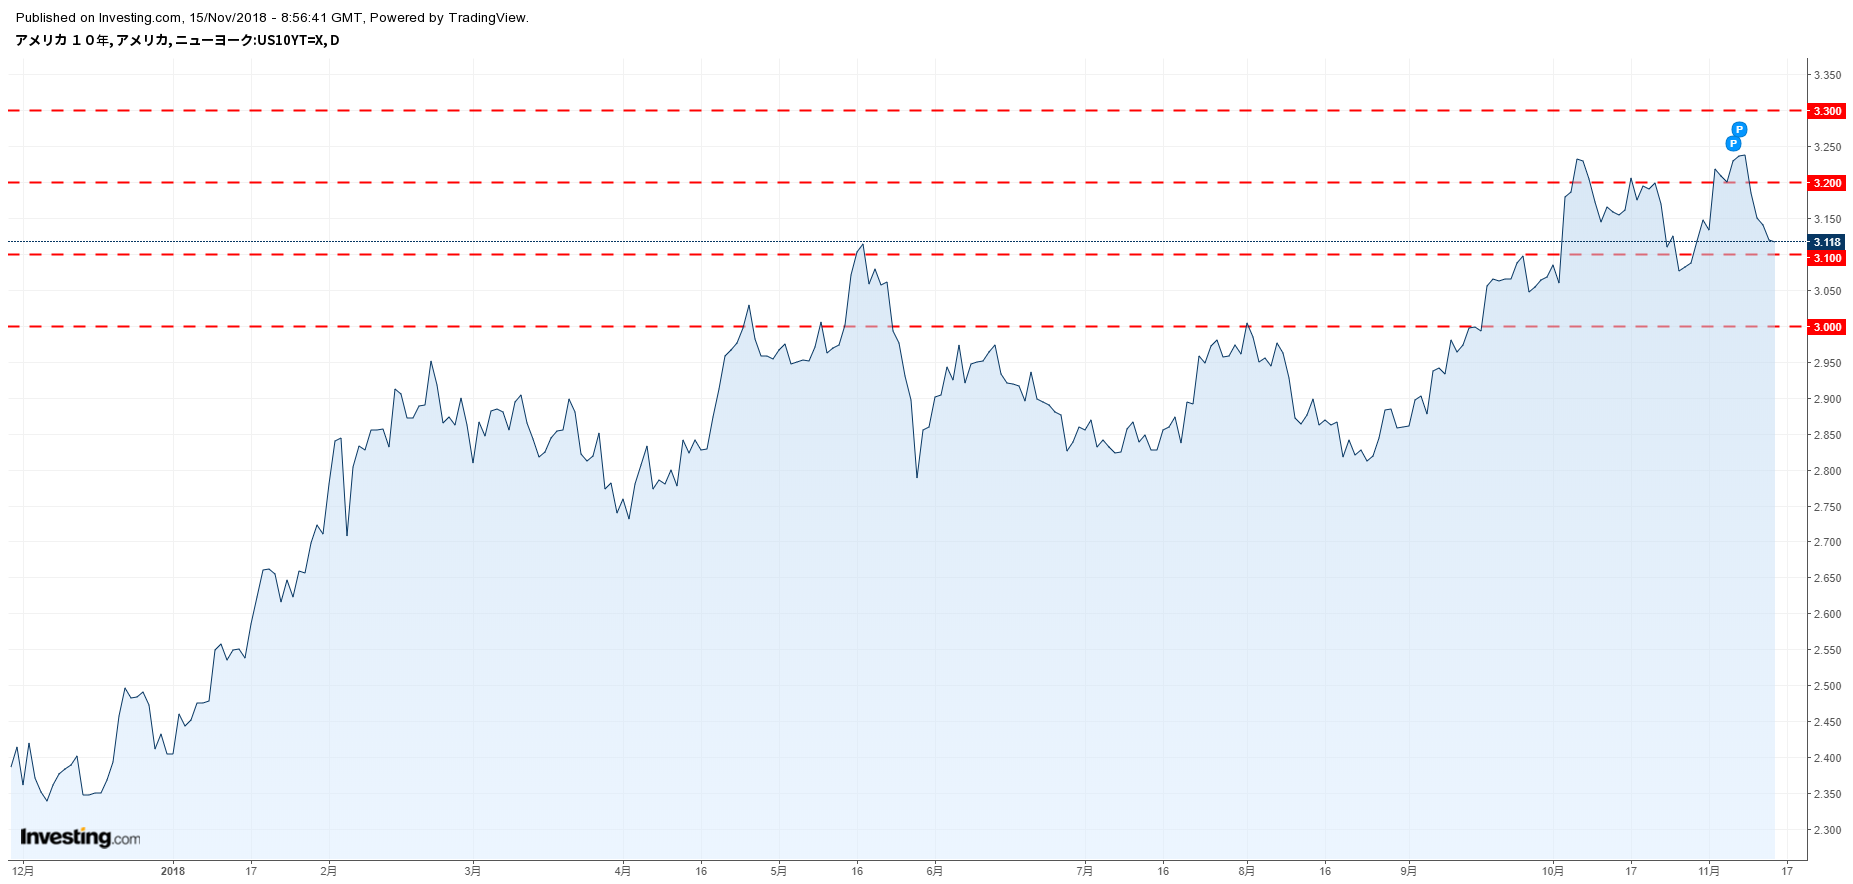
Document ②: US 10-year Treasury yield chart

Document ③: Dollar Index, daily chart
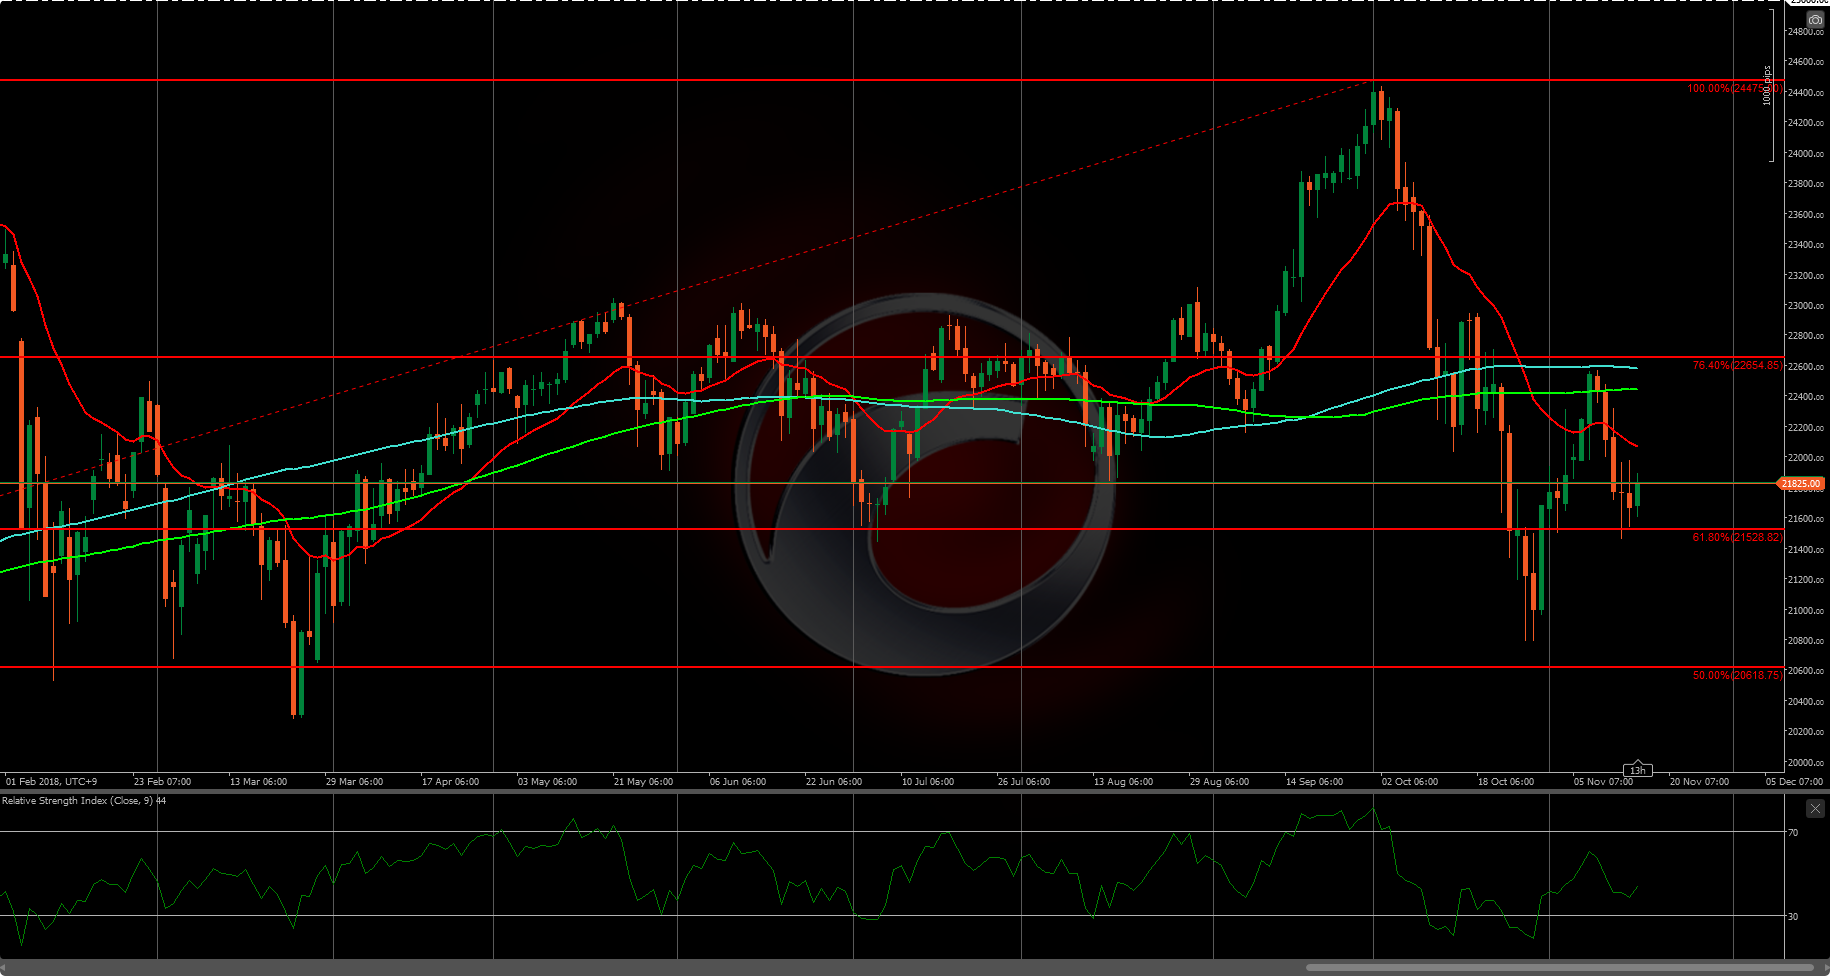
Document ④: Nikkei 225, daily chart
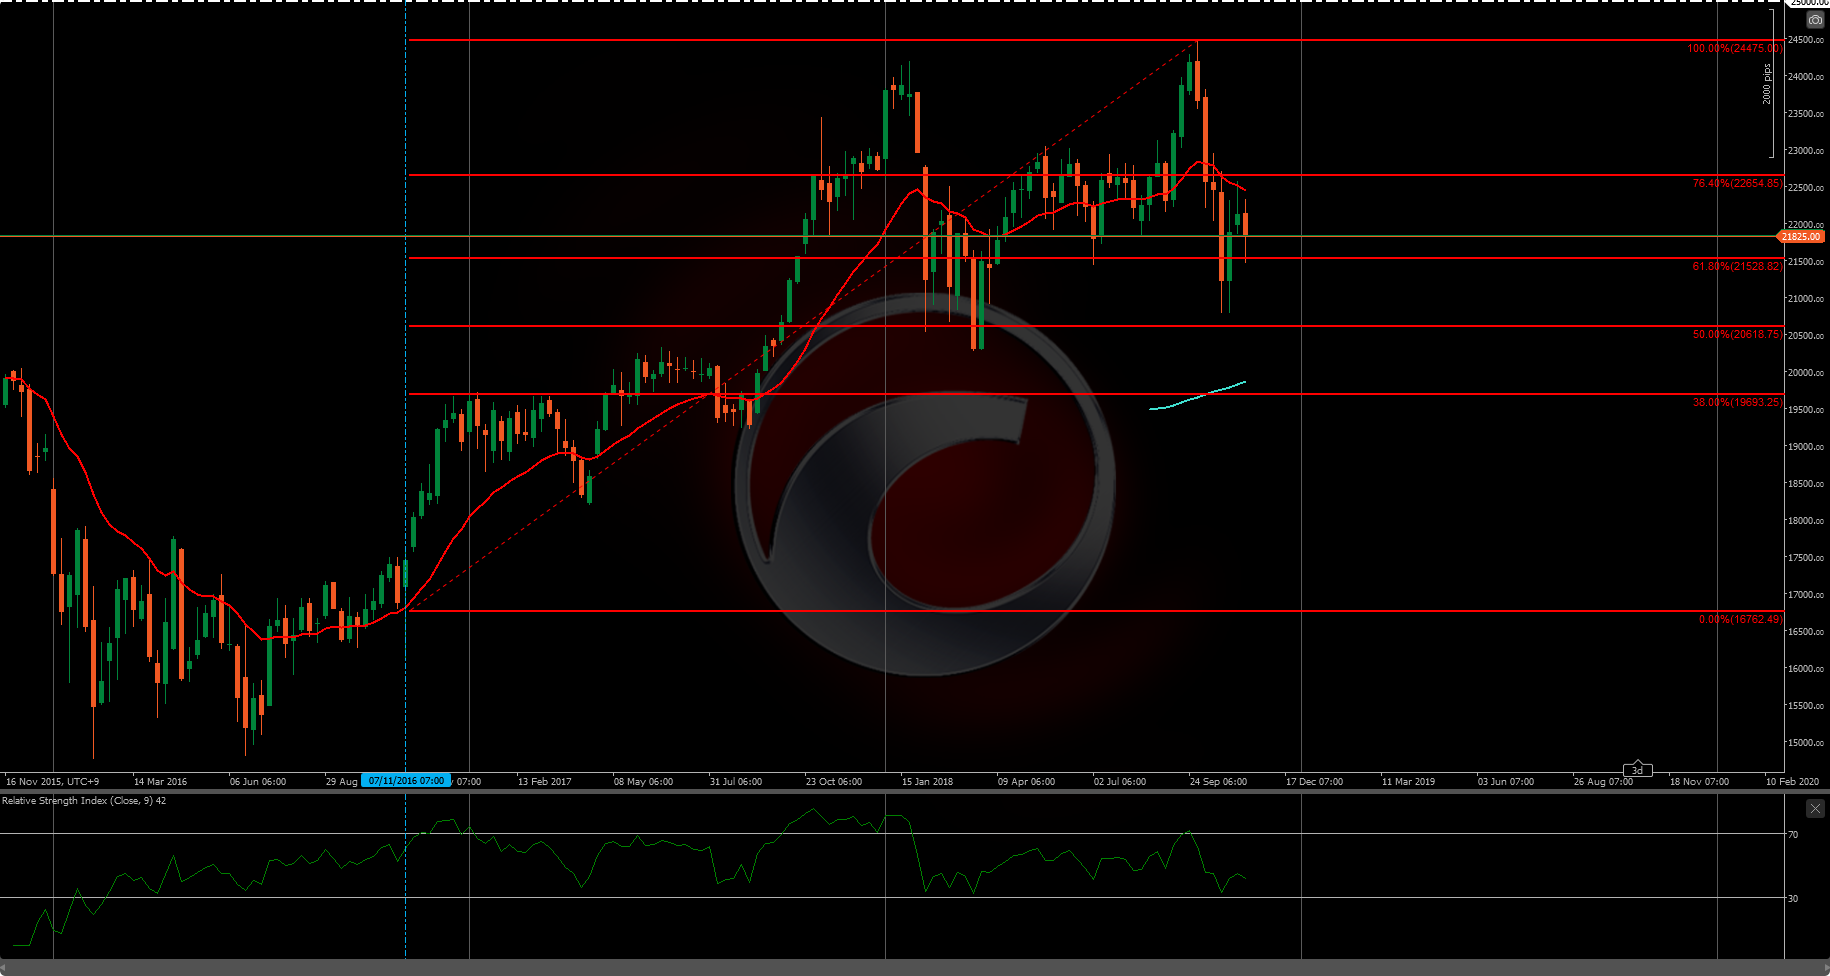
Document ⑤: Nikkei 225, weekly chart
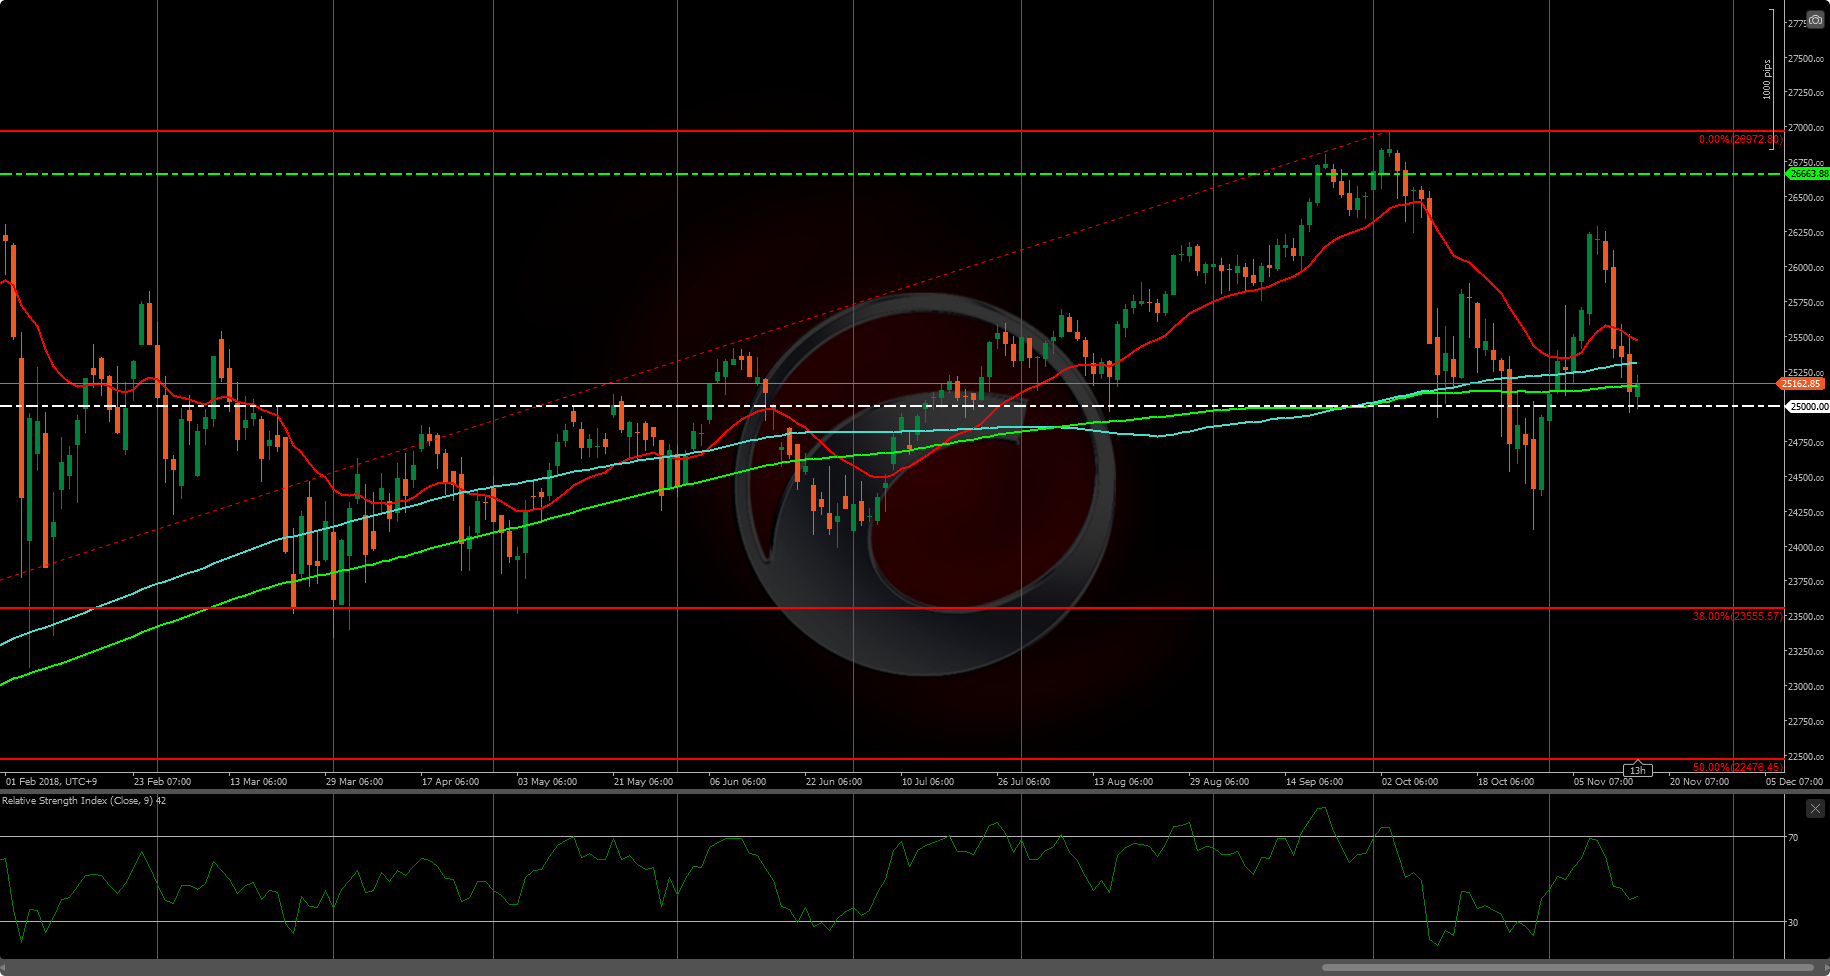
Document ⑥: Dow Jones, daily chart
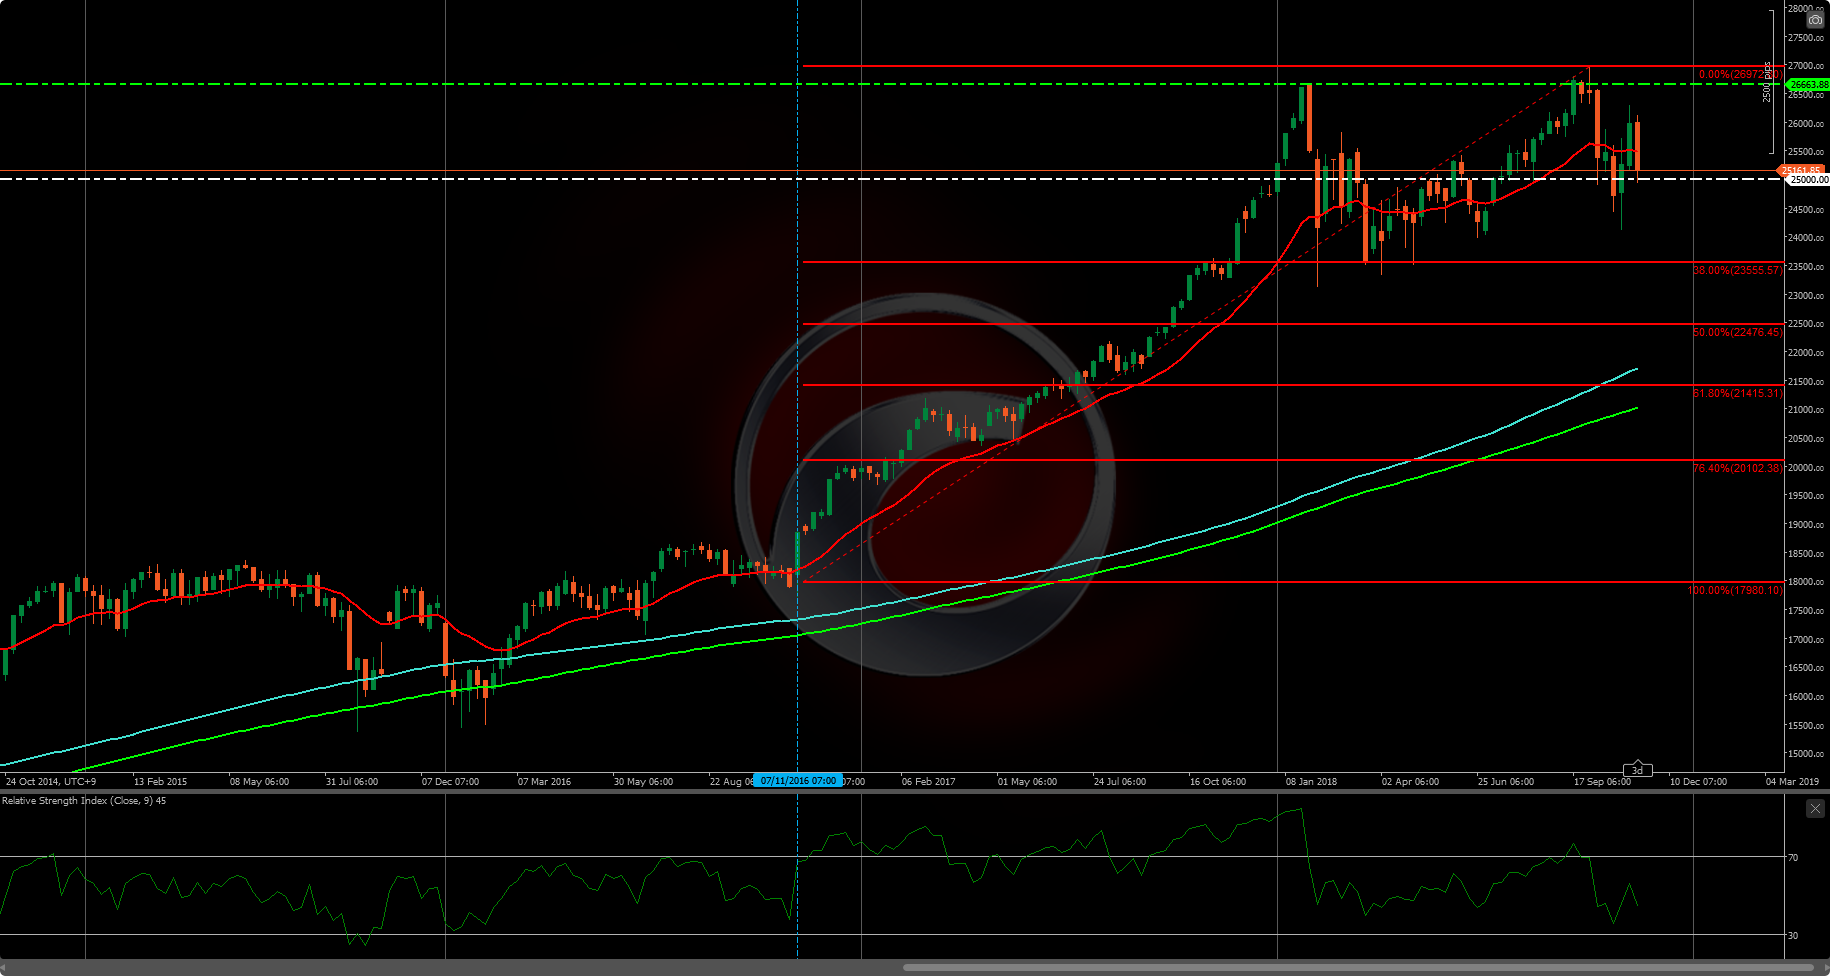
Document ⑦: Dow Jones, weekly chart

Document ⑧: WTI crude oil price, daily chart
Twitter is delivering real-time information from Okachan-man.
If you don’t mind, please follow!!
↓ ↓ ↓