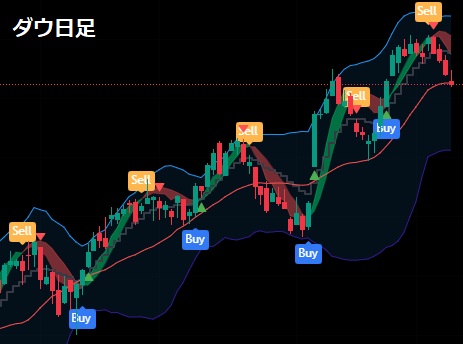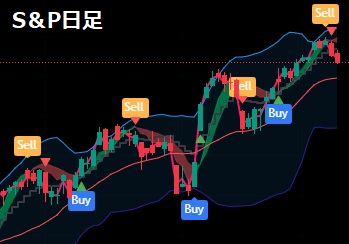

Dow and S&P decline after rally signals appeared. How far will they fall?
The Dow and the S&PSell signal has appeared and are now falling from that condition
The Dow has already reached the center of the Bollinger Bands and the S&P has not yet reached the center, so it seems likely to fall further around here
This indicator has the most profitable pattern, but I couldn’t enter because I’ve been focused on FX for a long time.
I don’t know how far it will drop, but there is a possibility it could fall to the opposite side of the Bollinger Bands
An indicator that shows the tops and bottoms
With this indicator, not only FX but also Nikkei, Dow, Nasdaq, SP, Gold, Crude Oil, Bitcoin, etc. are supported, so please consider it