
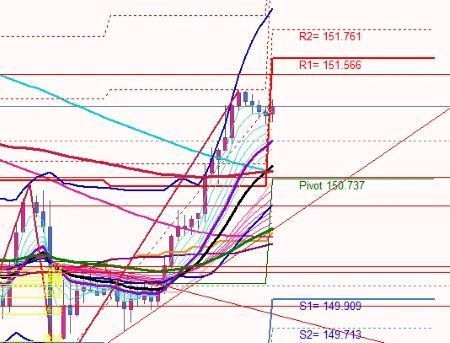
Before the US CPI, the USD/JPY range is perhaps around 150.737 to 151.566.
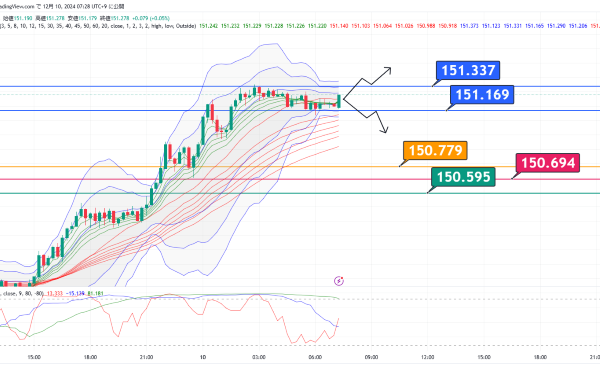
In the short term
151.337 Break Long
151.169 Break Short
The orange line below is the Fibonacci 0.382 (Pivot line is nearby as well)
Red is the resistance/support line
Green is the half-fib retracement line
How far will it push down if it does?
Looking from the 4-hour chart,
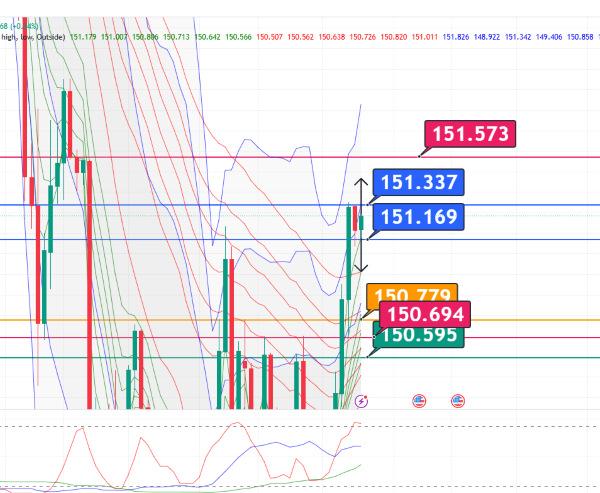
Around 151.537 is a resistance/support line
Will it go up to the next higher high?
Viewed on the 15-minute USD/JPY chart from a distance
It forms a clean bottom-long chart pattern
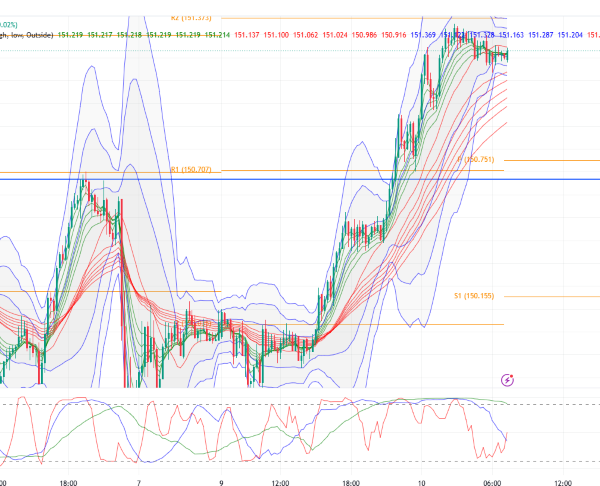
How far will it go?
From the pivot line, it may reach around 151.761
In the New York foreign exchange market
, with China signaling stronger stimulus, risk-on mood rose,
commodity currencies such as the Australian dollar, New Zealand dollar, and Norwegian krone were bought
while currencies considered safe assets were sold
The yen fell to the low 151s against the dollar. As U.S. time began,
a gradual decline expanded.
The Bank of Japan’s rate hike expectations for December appear to be fading
since the Bank of Japan policy meeting is scheduled the day after the FOMC results are announced,
there is a growing view that Japan would find it difficult to raise rates immediately after U.S. rate cuts
If U.S. rate cuts occur,
Japan would likely also refrain from hiking,
leading to expectations that the USD/JPY would struggle to move lower
since they want to hold off on rate hikes to prevent a further yen depreciation
if so, at the current level around 150 yen
it would mean the ace cannot be used
Yesterday's headline
“USD/JPY will it break out of the 150.707–149.369 range?”
It has broken out, hasn't it?
Today, the range seems likely to continue, but what will happen?
× ![]()