

Is the euro/yen more attractive than the dollar/yen because of stronger selling pressure?
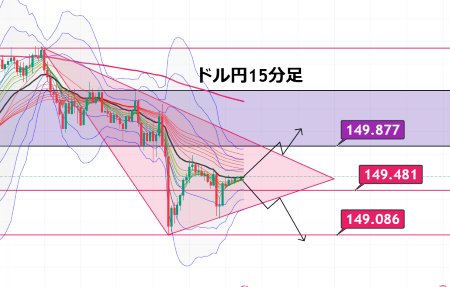
USD/JPY 15-minute chart
Last night’s [U.S.] ISM Manufacturing PMI (November) [46.5]
Forecast: 47.6
Actual: 48.4
A brief rise followed by a drop on this result
I sense strong downside pressure
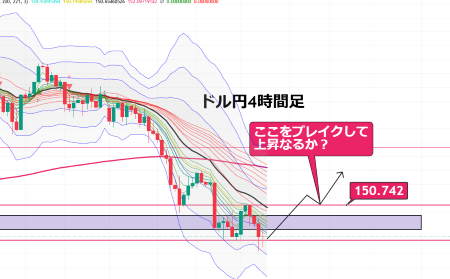
It resembles the four-hour chart pattern that began the current decline
Will we see a similar move this time in the short term?
What is the target if it declines?
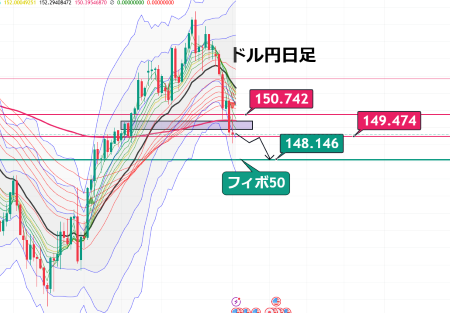
USD/JPY daily chart
A 50% pullback of the latest rise on the daily chart
148.146?
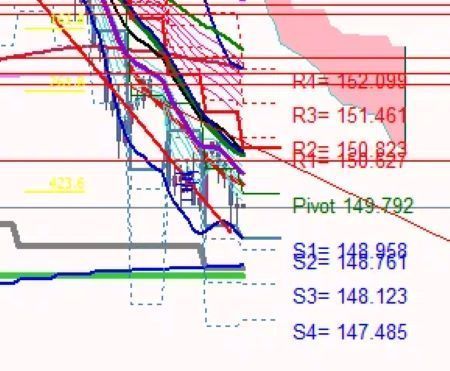
From a pivot line perspective
148.0Is that vicinity?
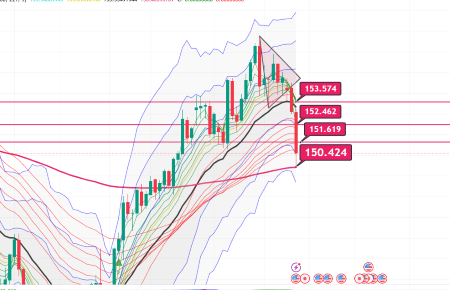
If it rises, this is the kind of image it would take
Euro weakness due to concerns about the French government collapsing
Marine Le Pen, leader of France’s far-right National Rally party
has hardened her stance on the budget debate
and this week the administration could fall
with high likelihood.
Yesterday, from early Asia time
euro selling was weighing on the EUR/USD
Meanwhile, USD/JPY has rebounded sharply as a counter-move to the previous week’s heavy selling and as dollar buying at the start of the month entered the market.
With GPIF’s target yield raised to 0.2%
there is speculation that investments in equities and overseas assets will increase,
and today’s Japanese stocks rose, with the dollar/yen holding firm
as a result
However, the BOJ’s rate hike is right around the corner
and this month’s rate hike is not a ceiling, but by summer could reach 0.75%
If that happens, it will be difficult for the USD/JPY to maintain upside momentum.
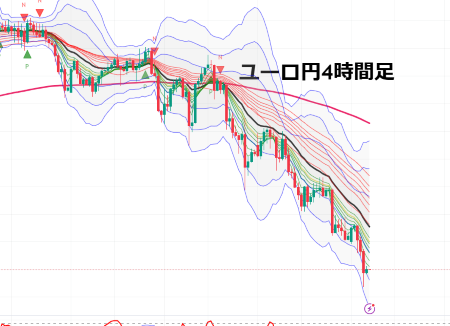
The USD/JPY is basically a selling on rallies, and
the downtrend in EUR/USD will not change
so I expect EUR/JPY to test lower levels further
as a development
× ![]()