
Triangle consolidation, breakout gap, and mBDSR (RCI2 double-filter) pullback sell signal
【Mastering RCI!! Trend Reversal, Buy on Dips, Sell on Rallies】
Indicator【BODSOR・mBDSR】that shines when paired with RCI
Methods and Case Studies (PDF) ★GogoJungle AWARD2020 Winner★
https://www.gogojungle.co.jp/tools/indicators/11836
USD/CHF 1-Hour
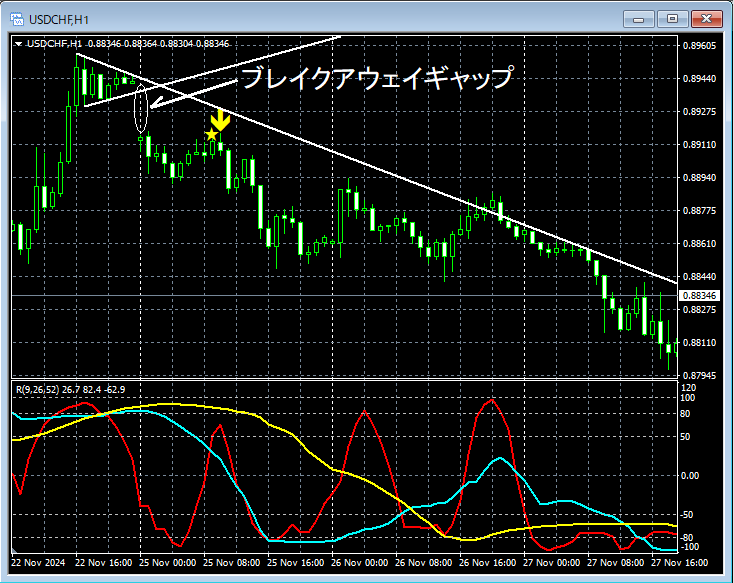
Looking at the 1-hour chart above, on Monday morninga triangle consolidationwas broken to the downside,an opening gapoccurred. After that,a gapwas hardly filled,the mBDSR sell signal (Filter: RCI26 and RCI52)lit up and the price dropped sharply.
From this example,the trading technique focused on Breakaway Gapsandthe compatibility with the mBDSR signalappear to be high.
※Please note that in the charts introduced in this article, for convenience of explanation, circles, straight lines, and squares may have been added.
Indicator that shines when paired with RCI【BODSOR・mBDSR】
Methods and Case Studies (PDF) ★GogoJungle AWARD2020 Winner★
https://www.gogojungle.co.jp/tools/indicators/11836
The PDF file includes 358 items (over 1,400 pages, over 470,000 characters).
Many of them areexamples that link the higher and lower timeframes logically using three RCI lines, examining multiple lower-timeframe conditions step by step, and ultimately waiting for a dip-buy or sell-on-rally timing on the lower timeframes (i.e., the mBDSR signal)..
Additionally,many focus on identifying points where multiple entry reasons overlap.
Note thatthere are also methods that explore upward and downward targets using the three RCI lines..
In the PDF descriptions,over 1,350 chartsare used.

Indicator【BODSOR・mBDSR】that shines when paired with RCI
Methods and Case Studies (PDF) ★GogoJungle AWARD2020 Winner★
https://www.gogojungle.co.jp/tools/indicators/11836
USD/CHF 1-Hour
Looking at the 1-hour chart above, on Monday morninga triangle consolidationwas broken to the downside,an opening gapoccurred. After that,a gapwas hardly filled,the mBDSR sell signal (Filter: RCI26 and RCI52)lit up and the price dropped sharply.
From this example,the trading technique focused on Breakaway Gapsandthe compatibility with the mBDSR signalappear to be high.
※Please note that in the charts introduced in this article, for convenience of explanation, circles, straight lines, and squares may have been added.
Indicator that shines when paired with RCI【BODSOR・mBDSR】
Methods and Case Studies (PDF) ★GogoJungle AWARD2020 Winner★
https://www.gogojungle.co.jp/tools/indicators/11836
The PDF file includes 358 items (over 1,400 pages, over 470,000 characters).
Many of them areexamples that link the higher and lower timeframes logically using three RCI lines, examining multiple lower-timeframe conditions step by step, and ultimately waiting for a dip-buy or sell-on-rally timing on the lower timeframes (i.e., the mBDSR signal)..
Additionally,many focus on identifying points where multiple entry reasons overlap.
Note thatthere are also methods that explore upward and downward targets using the three RCI lines..
In the PDF descriptions,over 1,350 chartsare used.