

【BTCJPY】20181109 Daily Pivot
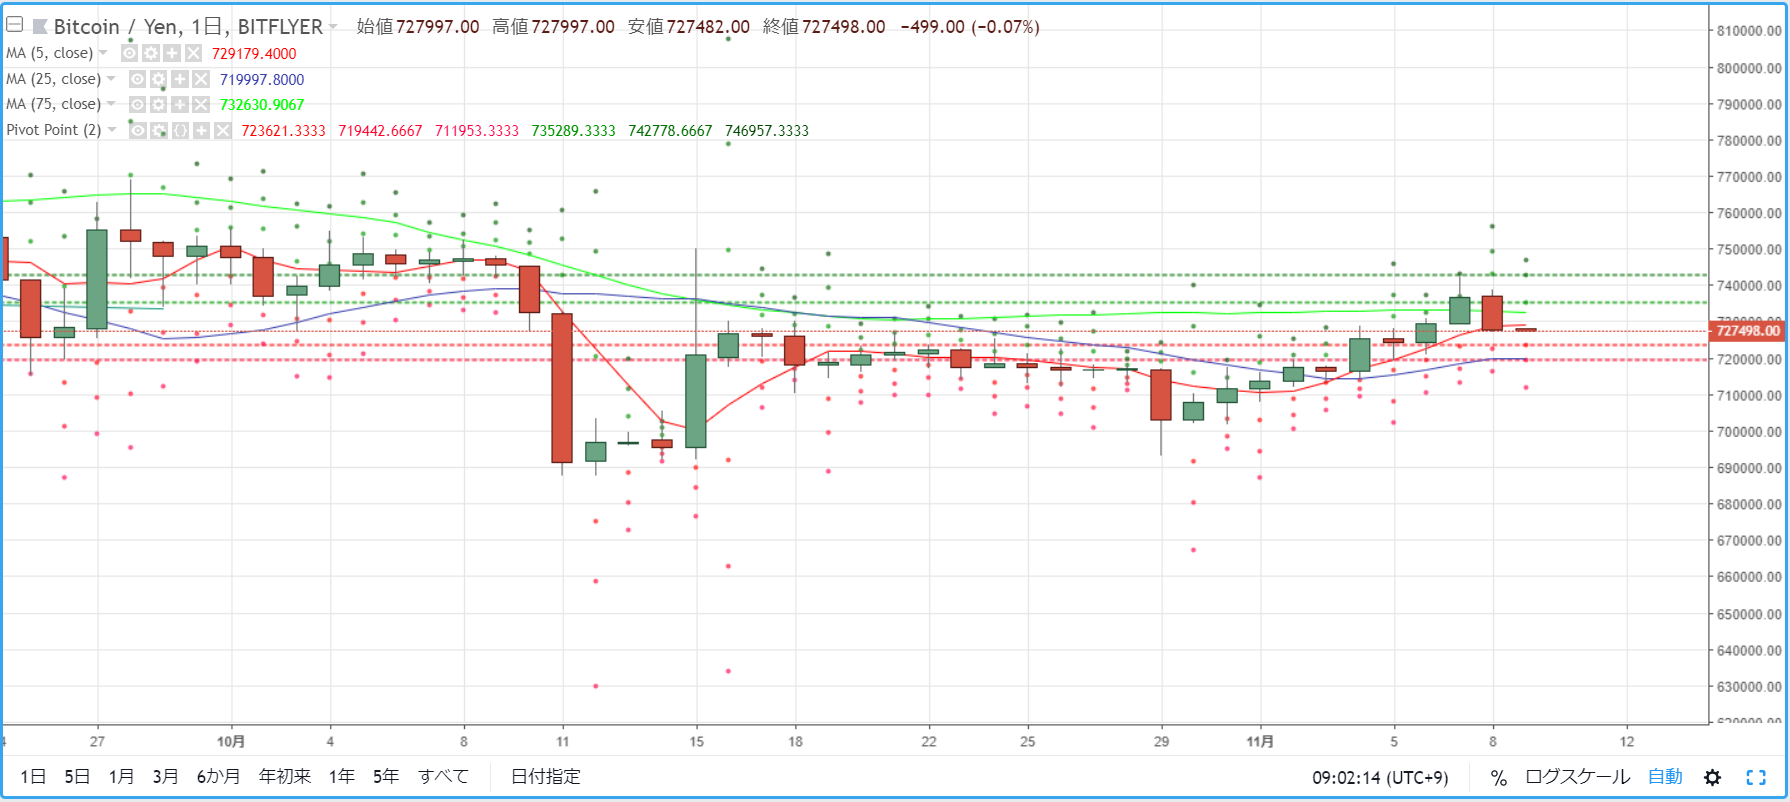
As a guideline for day trading BTCJPY, we check the pivot. Yesterday (November 8) there was strong selling pressure, forming a bearish candle that closed below the 75MA and 5MA. The market environment had exhausted all of the gains from the day before.
R2=742,778
R1=735,289
S1=723,621
S2=719,442
※ Pivot points are a technical indicator used to estimate the day's price movement based on the previous day's price action. Centered on the Pivot Point (PP), resistance lines (R1, R2) and support lines (S1, S2) are drawn above and below, and they are used as trading references.
【Calculation formulas】
Pivot Point (PP) = (Previous day's close + previous day's high + previous day's low) / 3
Resistance Line 1 (R1) = PP + (PP - previous day's low)
Support Line 1 (S1) = PP - (previous day's high - PP)
Resistance Line 2 (R2) = PP + (previous day's high - previous day's low)
Support Line 2 (S2) = PP - (previous day's high - previous day's low)


