

I feel a wall near USD/JPY around 154.29. Maybe I’ll go long~
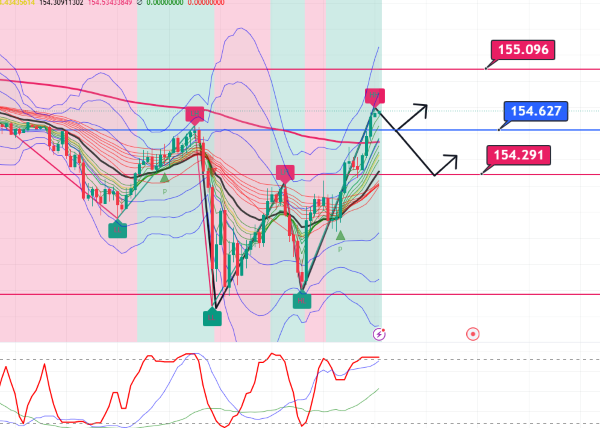
This is the USD/JPY 15-minute chart
Nice inverted W bottom forming, should rise
Around 154.291 is the pullback of the recent upward move, at the 38.2% Fibonacci level
Based on the chart shape, there will be a resistance there
Whether it will rebound and rise or not after pulling back
The GMMAs are pointing up
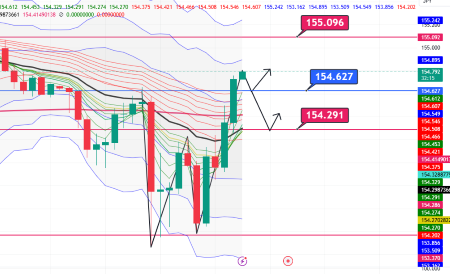
Looking at the 5-minute chart
It looks like this
Whether it will break below 154.6 in the short term; the 20 MA is approaching
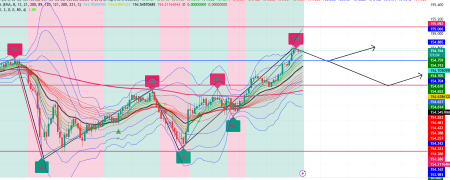
If you look at the 1-hour chart
The short-term GMMAs are turning up
There is a strong resistance around 154.29
Looking at it this way, today seems to carry expectations for the morning rise on Go-To day, but
There is something that concerns me a little
After last week's data release, it fell instead of rising
Yesterday it fell from the morning (though it reversed during the New York session...)
I feel a large trader was selling
Then, looking at the monthly chart
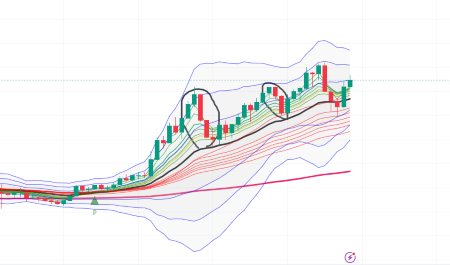
The black circled area represents the November-December declines (downward candles) over the past two years
This is the profit-taking by the large traders who had been long USD/JPY
In preparation for the European and American Christmas holidays
There are already large traders who have achieved their target
I think they initiated profit-taking selling
With that scenario, and about a month left until Christmas this year as well
I wonder if the large traders are aiming to sell
Although people say the Trump rally is over
They might be increasing buy orders of the large players
and initiating profit-taking selling around those levels
If today’s Tokyo mid-price strategy shows weak upward momentum,
I'll look for a move to go short after 10 o'clock
× ![]()