

The translated HTML content is: "ATS-11 Ma" optimization data release 2024/11/14 (Thursday)
Hello everyone, good evening. This is ATS BASE.
This time as well, we will 공개 a portion of the optimization data for MA cross extracted from the indicator "ATS-11 Ma".
We will publish part of the optimization data for MA cross.
Although it’s called a sample, it is practical enough to be used in real trading,
and we would be glad if you could use it for research or trading purposes.
Of course, we would like many people to use the paid version『ATS』, but before that!
「Trading that fits the current trend」This is the concept of the method developed to trade in line with the current trend,
Please look at the sample data and actual results, and we have prepared several articles to explain the wonderfulness and effectiveness of this system.
This post corresponds to the following table’s■part.
Using MA cross to trade in line with the current trend,
we would like to introduce some of the data extracted from “ATS”.
We will explain how to read and use this data at the end!
(Paid Version) |
(8 sessions total) (Free) |
(Free) |
(Free) |
||
| ATS-12 RSI | [From here] |
Free公開中! [From here] |
公開中! [From here] |
Continuing! [From here] |
|
| ATS-13 RCI | [From here] |
Now公開中! [From here] |
公開中! [From here] |
By using it you can win! [From here] |
|
| ATS-11 Ma | [From here] |
Starting soon! |
|
Continuing! [From here] |

【Today's published data】
It turned out like this.
Recently the MA is performing well (winning),
so I think it has substantial credibility.
>Performance of ATS using MA cross is here
How to read the data!
This time, from many data that hit favorable conditions, we published five optimization data sets.
If you use “ATS-11 Ma”, you can view data for all currency pairs, all time frames, and all optimized entries!Click here for “ATS-11 Ma”!
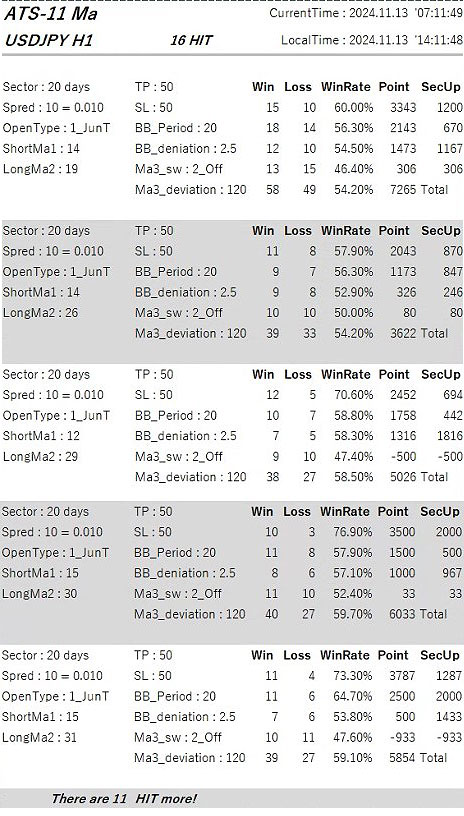
Now, I will explain how to read the data. First, the header.

In the USDJPY 30-minute chart, it means that 80 optimization data entries were found.
“CurrentTime” and “LocalTime” are respectively the MT4 server time during the search and the local time on your work PC.
Basically, it is divided into「① Settings」 and「② Backtest results」. It shows what results were obtained under this condition.
This is the same as backtesting in EA.
Furthermore, the results are aggregated into four sectors (periods).

Now, let’s read in numerical order!

③「Sector」:The unit of aggregation. The data is “20 days,” but please first look at the results on the right side ⑪. There are four rows of data, indicating that it is aggregated across four periods. Each “one line” corresponds to a 20-day aggregation. And ⑫ is the total for all periods (80 days).
④「Spred」:To get more accurate results, you must also consider the negative element spreads. For USDJPY, “10 = 0.01” means 1 sen (penny).
⑤「OpenType」:This is a very important part that decides whether to take positions in a trend-following or counter-trend manner when two MAs cross. In this case it shows “1_JunT,” so when the short-term MA crosses the long-term MA, you take a position in the same direction (trend-following). For counter-trend, it would display “2_GykT.”
⑥「ShortMa1」:Represents the Period (count) of the short-term MA among the two MAs.
⑦「LongMa2」:Represents the Period (count) of the long-term MA among the two MAs. Together with ⑥, the combination of these two Period values is very important. Using settings that fit the current trend can more effectively generate profit.
⑧「TP」と「SL」:Take Profit and Stop Loss. In USDJPY, 100 means 1 yen.
⑨「BB_Period」と「BB_deniation」:Equipped with a safety mechanism using Bollinger Bands. When a sharp change occurs, the immediate movement is hard to read and spreads can widen unfavorably, so it is prudent not to take positions at such times. “20” and “2.5” mean Bollinger Bands with 20 bands and deviation of 2.5 (outside), where positions are not taken.
⑩「Ma3_sw」と「Ma3_Deviation」:The condition to take a position is determined by the cross of the two MAs in ⑥ and ⑦, but another MA is used as a filter to decide whether to consider the longer-term trend. In this figure, “Ma3_sw” is “2_off,” so regardless of Ma3_Deviation value this filter does not affect position entry. If it shows “1_Jun” and Ma3_Deviation is “120,” positions are taken only when the long-term trend of 120 MAs is in the same direction. If Ma3_sw is “3_Gyk” and Ma3_Deviation is “120,” positions are taken when the long-term trend of 120 MAs is in the opposite direction.
⑪This system aggregates data in four sectors (periods). This is very important. Each data entry from the left shows “Wins,” “Losses,” “Win Rate,” and “Subtotal Points.” “SecUp” shows the point difference from the previous period. This helps determine whether this setting is trending upward.
⑫Total for four sectors (periods) and all time. The Points “6,382” means there was a plus of 6 yen 38.2 sen over 80 days, excluding spreads. That’s impressive!
Examples of data usage!

If you use this data, you can set the indicator on a chart like this and trade the best possible way! You can also enjoy using it with other tools for comparison.
We will continue to work hard so that everyone who uses this will gain plenty of profit!!