

"ATS-11 Ma" optimization data publication October 28, 2024 (Monday)
The data introduced here are a portion of the optimization data extracted from the "ATS-11 Ma". Although it is a sample, it is practical enough for real-world use, so we would be pleased if you could use it for research or trading purposes.
Of course, we would like many people to use the paid version of『ATS』, but before that!
“Trading that fits the current trend”We developed this method to perform such trading, and we have prepared several articles by looking at the concept, sample data, and performance to help you understand the excellence and effectiveness of this system.
This post corresponds to the part of the table■.
Using RSI to trade in line with the current trend, we will introduce a portion of the data extracted from “ATS”.
How to read and use this data will be explained again at the end!

It’s finally time!
【Today's Public Data】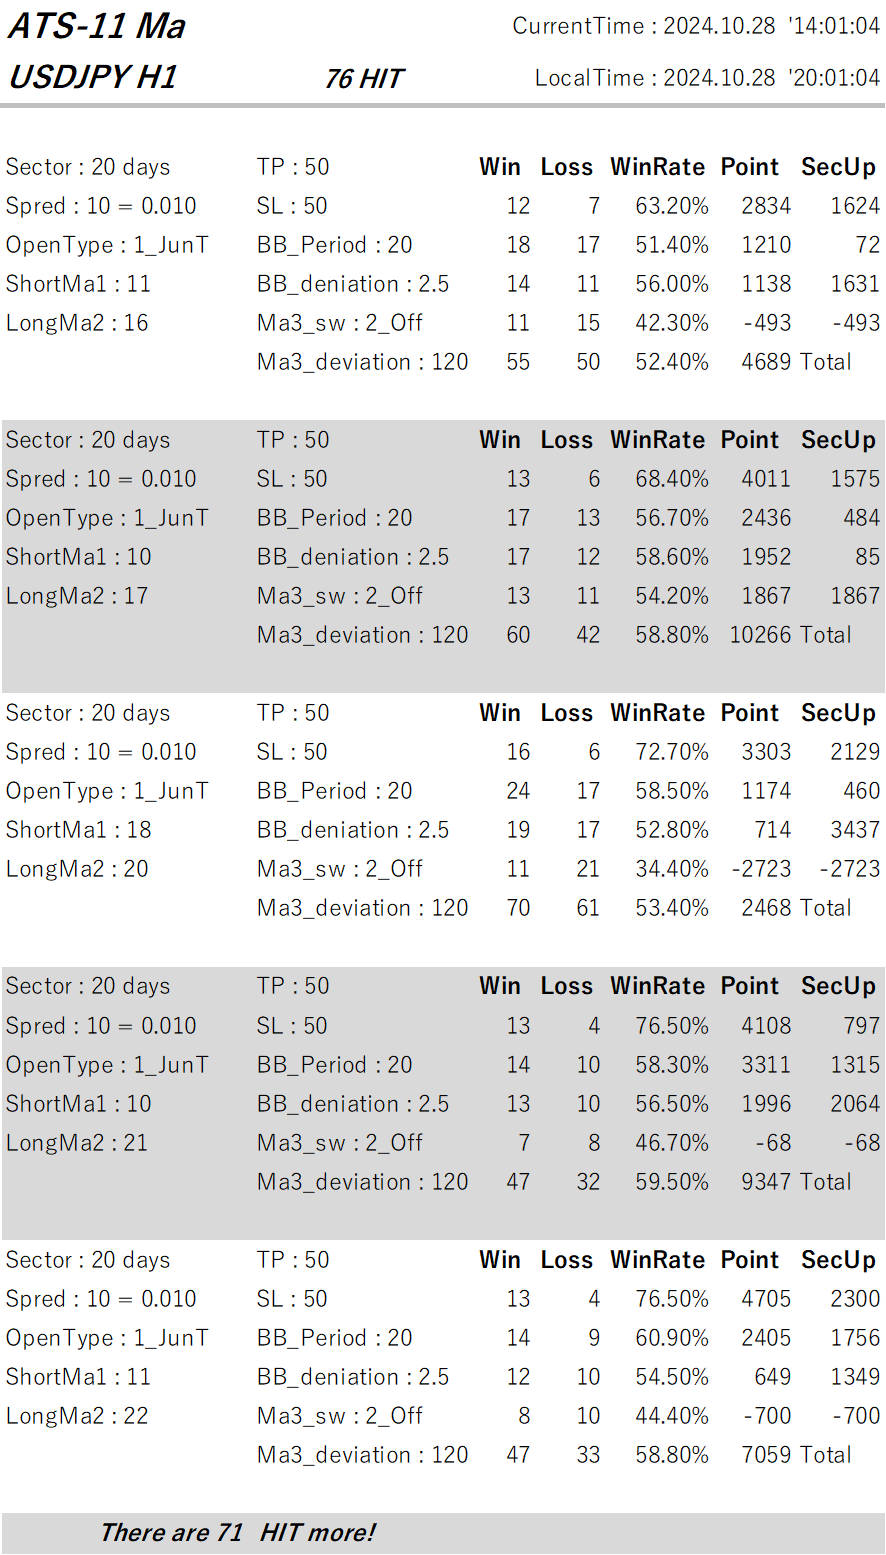
How to read the data!
This time, among many data that met favorable conditions, five variants of optimized data are posted.
If you use『ATS-11 Ma』, you can view all currency pairs, all timeframes, and all optimized data records!『ATS-11 Ma』 here!
Now, we will explain how to read the data. First, the header section.
In the USDJPY 30-minute chart, it means that there were “80 items” of optimized data found.
“CurrentTime” and “LocalTime” are respectively the MT4 server time used for the search and the local time of the working PC.
This is broadly divided into“①Settings” part and“②Backtest results”part.
This shows what results would have been obtained by trading under these conditions.
It is the same as backtests in EA.
Furthermore, these results are grouped into four sectors (periods).
Now, let’s view them in order!
③“Sector”:The unit used for aggregation. The data are 20 days, but first look at the result on the right side ⑪. There are four rows of data, indicating that they are aggregated over four periods. Each row represents the aggregation result over 20 days. And ⑫ is the total for all periods over 80 days.
④“Spred”:To obtain more accurate results, you must also properly consider negative elements of the spread. For USDJPY, “10 = 0.01” means 1 sen (penny).
⑤“OpenType”:Is a crucial setting that determines whether to take positions on a trend-following or contrarian basis when the two Ma (moving averages) cross. In this case it is “1_JunT”, so when the short-term Ma crosses the long-term Ma, a position is opened in the same direction. That is trend-following. For contrarian, it would display “2_GykT”.
⑥“ShortMa1”:Represents the Period (number of bars) of the short-term Ma among the two MAs.
⑦“LongMa2”:Represents the Period (number of bars) of the long-term Ma among the two MAs. Including ⑥, the combination of these two periods is very important. Using a setting that fits the current trend can more effectively entice profits.
⑧“TP” and “SL”:Take Profit and Stop Loss. For USDJPY, 100 means 1 yen.
⑨“BB_Period” and “BB_deniation”:Equipped with a safety device using Bollinger Bands. When abrupt changes occur, the immediate direction may be unpredictable and spreads can widen, making it unfavorable. In such cases, it is prudent not to take a position. “20” and “2.5” refer to the Bollinger band with a deviation of 2.5 using 20 bands, and no position is taken outside that range.
⑩“Ma3_sw” and “Ma3_Deviation”:The entry condition is determined by the cross of the two MAs in ⑥ and ⑦, but another MA is used as a filter to decide whether to align with the longer-term trend. In the figure, “Ma3_sw” is “2_off”, so no matter what the Ma3_Deviation value is, this filter does not affect entry. If it shows “1_Jun” and “Ma3_Deviation” is 120, then entries occur only when the long-term trend of 120 MAs is in the same direction. If “Ma3_sw” is “3_Gyk” and “Ma3_Deviation” is 120, entries occur when the long-term trend is in the opposite direction.
⑪This system is aggregated into four sectors (periods). This is very meaningful. Each data item from the left shows “Wins,” “Losses,” “Win Rate,” and “Subtotal Points.” “SecUp” shows the point difference from the previous period. This helps determine whether this setting is on an upward trend or not.
⑫Total for four sectors (periods) and all time. The Point “6,382” indicates that over 80 days, even after subtracting the spread, there was a positive gain of 6.38 yen. That’s an impressive gain!
Examples of using the data!
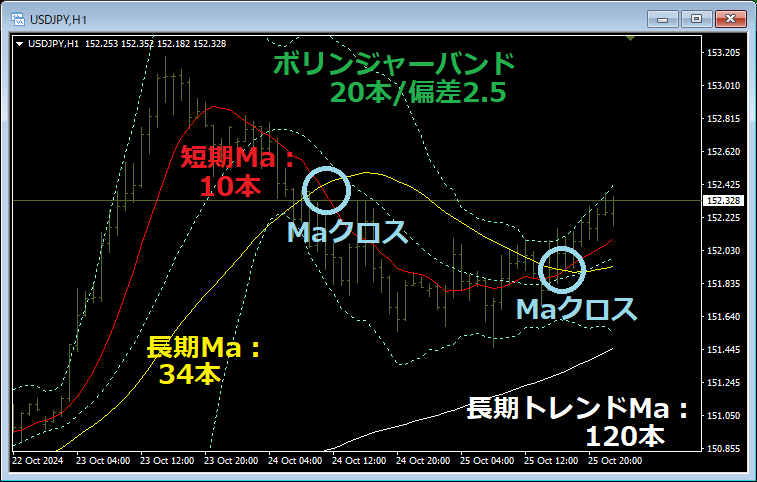
If you use this data, you can set indicators on the chart like this to perform the best trades! You can also enjoy using it with other tools or by making comparisons.
We will continue to strive so that everyone who uses this can achieve substantial profits!!
Of course, we would like many people to use the paid version of『ATS』, but before that!
“Trading that fits the current trend”We developed this method to perform such trading, and we have prepared several articles by looking at the concept, sample data, and performance to help you understand the excellence and effectiveness of this system.
This post corresponds to the part of the table■.
Using RSI to trade in line with the current trend, we will introduce a portion of the data extracted from “ATS”.
How to read and use this data will be explained again at the end!
(Paid Version) |
(All 8 sessions) (Free) |
(Free) |
(Free) |
||
| ATS-12 RSI | 70% OFF [From here] |
Freely Available! [From here] |
to view! [From here] |
Continuing! [From here] |
|
| ATS-13 RCI | 75% OFF [From here] |
Free of charge Now available! [From here] |
Now available! [From here] |
helped me win! [From here] |
|
| ATS-11 Ma | 80% OFF [From here] |
Start planned! |
|
Continuing! [From here] |
【Today's Public Data】
How to read the data!
This time, among many data that met favorable conditions, five variants of optimized data are posted.
If you use『ATS-11 Ma』, you can view all currency pairs, all timeframes, and all optimized data records!『ATS-11 Ma』 here!
Now, we will explain how to read the data. First, the header section.
In the USDJPY 30-minute chart, it means that there were “80 items” of optimized data found.
“CurrentTime” and “LocalTime” are respectively the MT4 server time used for the search and the local time of the working PC.
This is broadly divided into“①Settings” part and“②Backtest results”part.
This shows what results would have been obtained by trading under these conditions.
It is the same as backtests in EA.
Furthermore, these results are grouped into four sectors (periods).
Now, let’s view them in order!
③“Sector”:The unit used for aggregation. The data are 20 days, but first look at the result on the right side ⑪. There are four rows of data, indicating that they are aggregated over four periods. Each row represents the aggregation result over 20 days. And ⑫ is the total for all periods over 80 days.
④“Spred”:To obtain more accurate results, you must also properly consider negative elements of the spread. For USDJPY, “10 = 0.01” means 1 sen (penny).
⑤“OpenType”:Is a crucial setting that determines whether to take positions on a trend-following or contrarian basis when the two Ma (moving averages) cross. In this case it is “1_JunT”, so when the short-term Ma crosses the long-term Ma, a position is opened in the same direction. That is trend-following. For contrarian, it would display “2_GykT”.
⑥“ShortMa1”:Represents the Period (number of bars) of the short-term Ma among the two MAs.
⑦“LongMa2”:Represents the Period (number of bars) of the long-term Ma among the two MAs. Including ⑥, the combination of these two periods is very important. Using a setting that fits the current trend can more effectively entice profits.
⑧“TP” and “SL”:Take Profit and Stop Loss. For USDJPY, 100 means 1 yen.
⑨“BB_Period” and “BB_deniation”:Equipped with a safety device using Bollinger Bands. When abrupt changes occur, the immediate direction may be unpredictable and spreads can widen, making it unfavorable. In such cases, it is prudent not to take a position. “20” and “2.5” refer to the Bollinger band with a deviation of 2.5 using 20 bands, and no position is taken outside that range.
⑩“Ma3_sw” and “Ma3_Deviation”:The entry condition is determined by the cross of the two MAs in ⑥ and ⑦, but another MA is used as a filter to decide whether to align with the longer-term trend. In the figure, “Ma3_sw” is “2_off”, so no matter what the Ma3_Deviation value is, this filter does not affect entry. If it shows “1_Jun” and “Ma3_Deviation” is 120, then entries occur only when the long-term trend of 120 MAs is in the same direction. If “Ma3_sw” is “3_Gyk” and “Ma3_Deviation” is 120, entries occur when the long-term trend is in the opposite direction.
⑪This system is aggregated into four sectors (periods). This is very meaningful. Each data item from the left shows “Wins,” “Losses,” “Win Rate,” and “Subtotal Points.” “SecUp” shows the point difference from the previous period. This helps determine whether this setting is on an upward trend or not.
⑫Total for four sectors (periods) and all time. The Point “6,382” indicates that over 80 days, even after subtracting the spread, there was a positive gain of 6.38 yen. That’s an impressive gain!
Examples of using the data!
If you use this data, you can set indicators on the chart like this to perform the best trades! You can also enjoy using it with other tools or by making comparisons.
We will continue to strive so that everyone who uses this can achieve substantial profits!!
× ![]()