

【BTCJPY】20181107 Daily Pivot
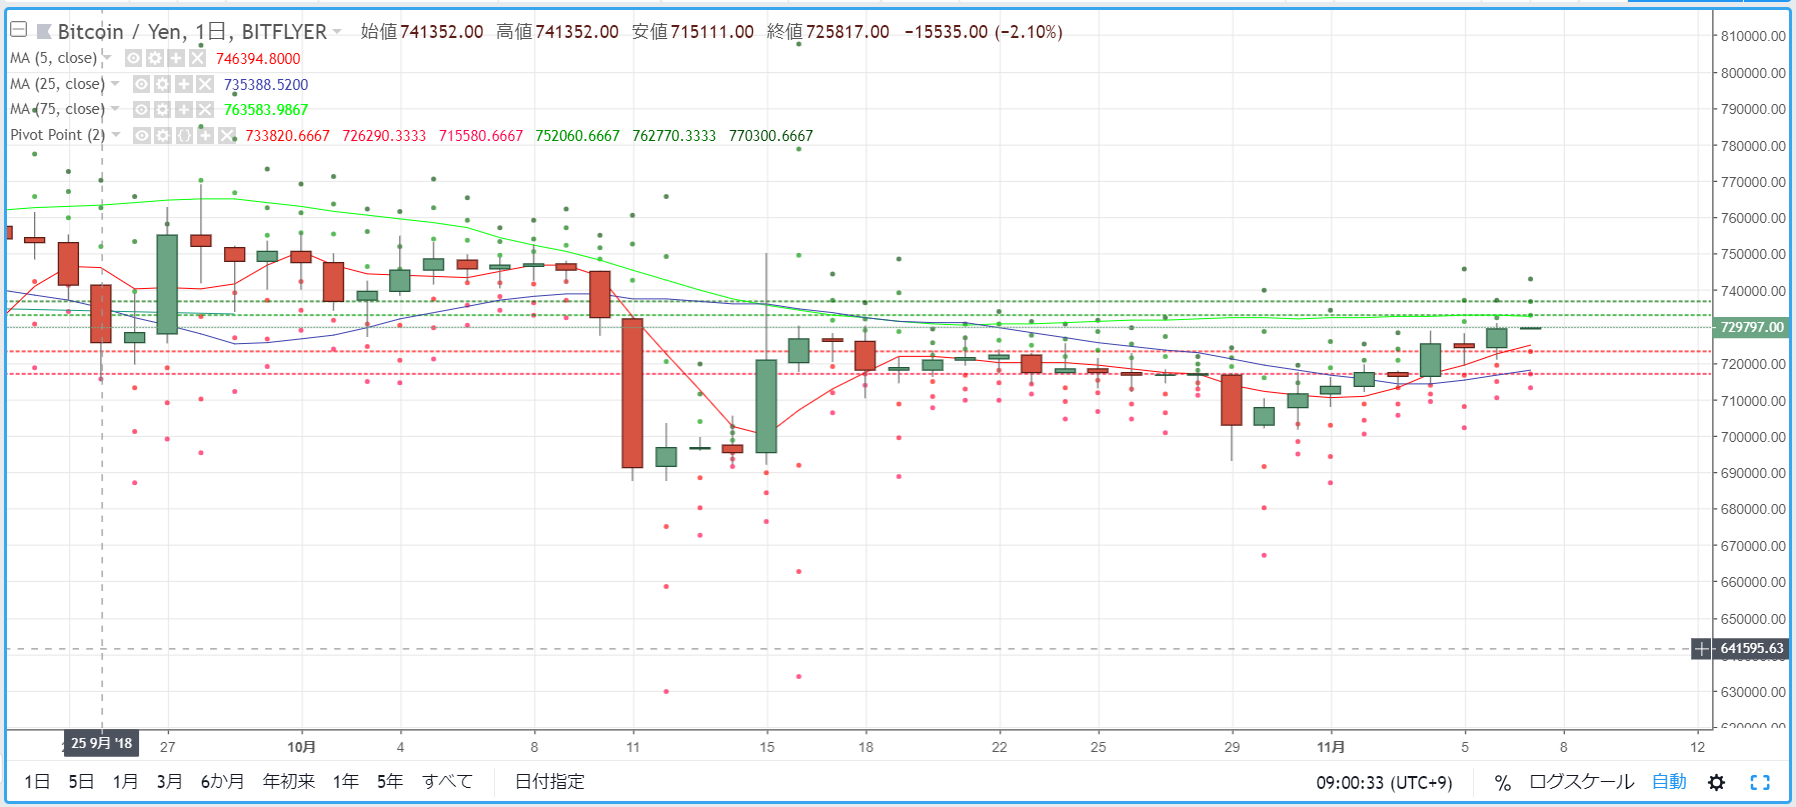
As a guideline for day trading BTCJPY, we check the pivot. Yesterday (November 6) moved between the 5MA and 75MA. It formed a bullish candle and closed near 7.3 million yen in that market environment.
R2=762,770
R1=752,060
S1=733,820
S2=726,290
※ A pivot is a technical indicator that estimates the price range for the current day based on the previous day’s price movement. Centered on the Pivot Point (PP), draw resistance lines (R1, R2) above and below and support lines (S1, S2) below, using them as trading references.
【Calculation formulas】
Pivot Point (PP) = (Previous day's close + previous day's high + previous day's low) / 3
Resistance Line 1 (R1) = PP + (PP - previous day's low)
Support Line 1 (S1) = PP - (previous day's high - PP)
Resistance Line 2 (R2) = PP + (previous day's high - previous day's low)
Support Line 2 (S2) = PP - (previous day's high - previous day's low)


