

【BTCJPY】20181105 Daily Pivot
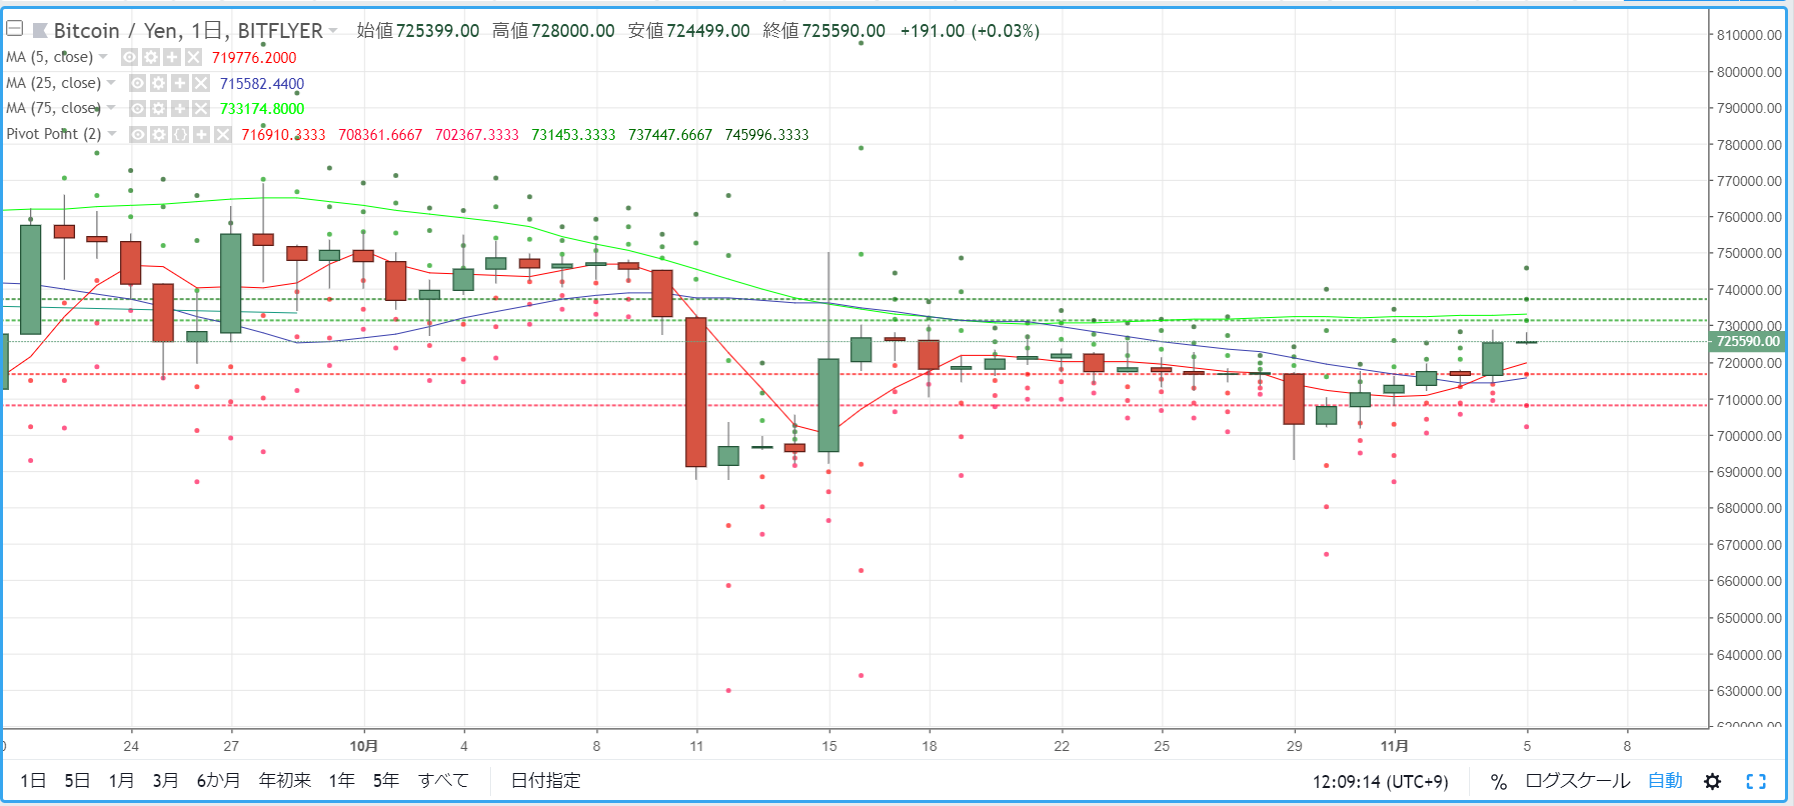
As a guide for day trading BTCJPY, we check the pivot. Yesterday (November 4) there was strong buying momentum, forming a solid bullish candlestick. The market environment rose back into the upper 720,000 yen range for the first time in a while.
R2=737,447
R1=731,453
S1=716,910
S2=708,361
※ A pivot is a technical indicator that estimates the range of price movement for the day based on the previous day's price action. Centered on the Pivot Point (PP), draw resistance lines (R1, R2) and support lines (S1, S2) above and below, and use them as trading references.
【Calculations】
Pivot Point (PP) = (Previous day close + previous day high + previous day low) / 3
Resistance Line 1 (R1) = PP + (PP - previous day low)
Support Line 1 (S1) = PP - (previous day high - PP)
Resistance Line 2 (R2) = PP + (previous day high - previous day low)
Support Line 2 (S2) = PP - (previous day high - previous day low)


