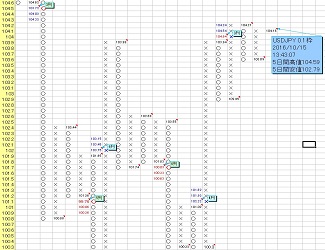

GBP/JPY has triggered an additional up signal (Point & Figure - Stochastics).
Slow Stochastics
Blue line = %K, pink line = %D, yellow line = Slow %D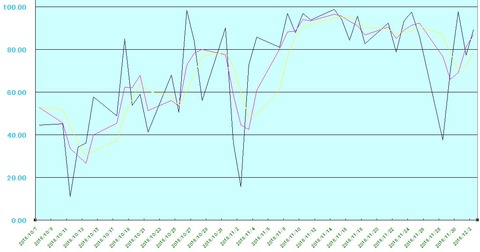
0.2 yen frame P&F chart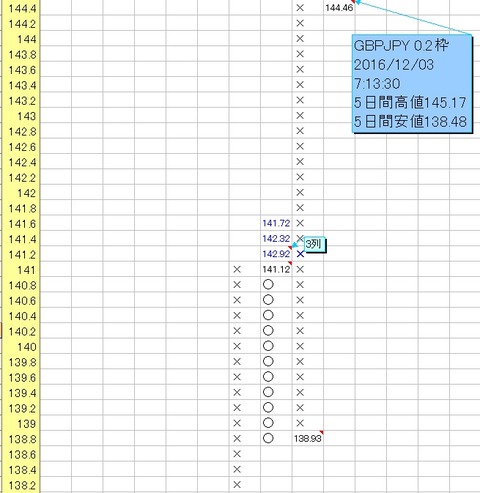
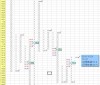
0.5 yen frame P&F chart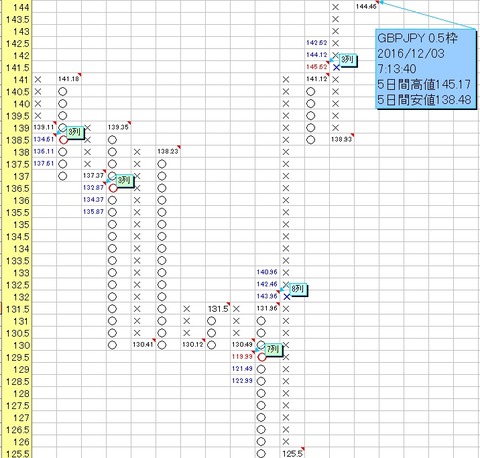
As noted above, GBP/JPY 0.2 yen and 0.5 yen frame points & figure chart have lit up with an additional bullish signal.
The maximum target for the 0.2 yen frame has already been reached at 142.92 yen.
The maximum target for the 0.5 yen frame is automatically calculated by the tool as 145.62 yen.
However, in the above Slow Stochastics, a downward divergence has occurred repeatedly ( ).
The GBP/JPY uptrend seems likely to continue and may push a bit higher, but chasing upside from here could be risky.
※Even if the market makes new highs or new lows, if the stochastics do not confirm this with new highs or lows, it is called a divergence of the Stochastics.
Points & Figures (Secret Chart) Screen Introduction
For those who want to know more about Points & Figures (Secret Chart)