

【BTCJPY】20181101 Daily Pivot
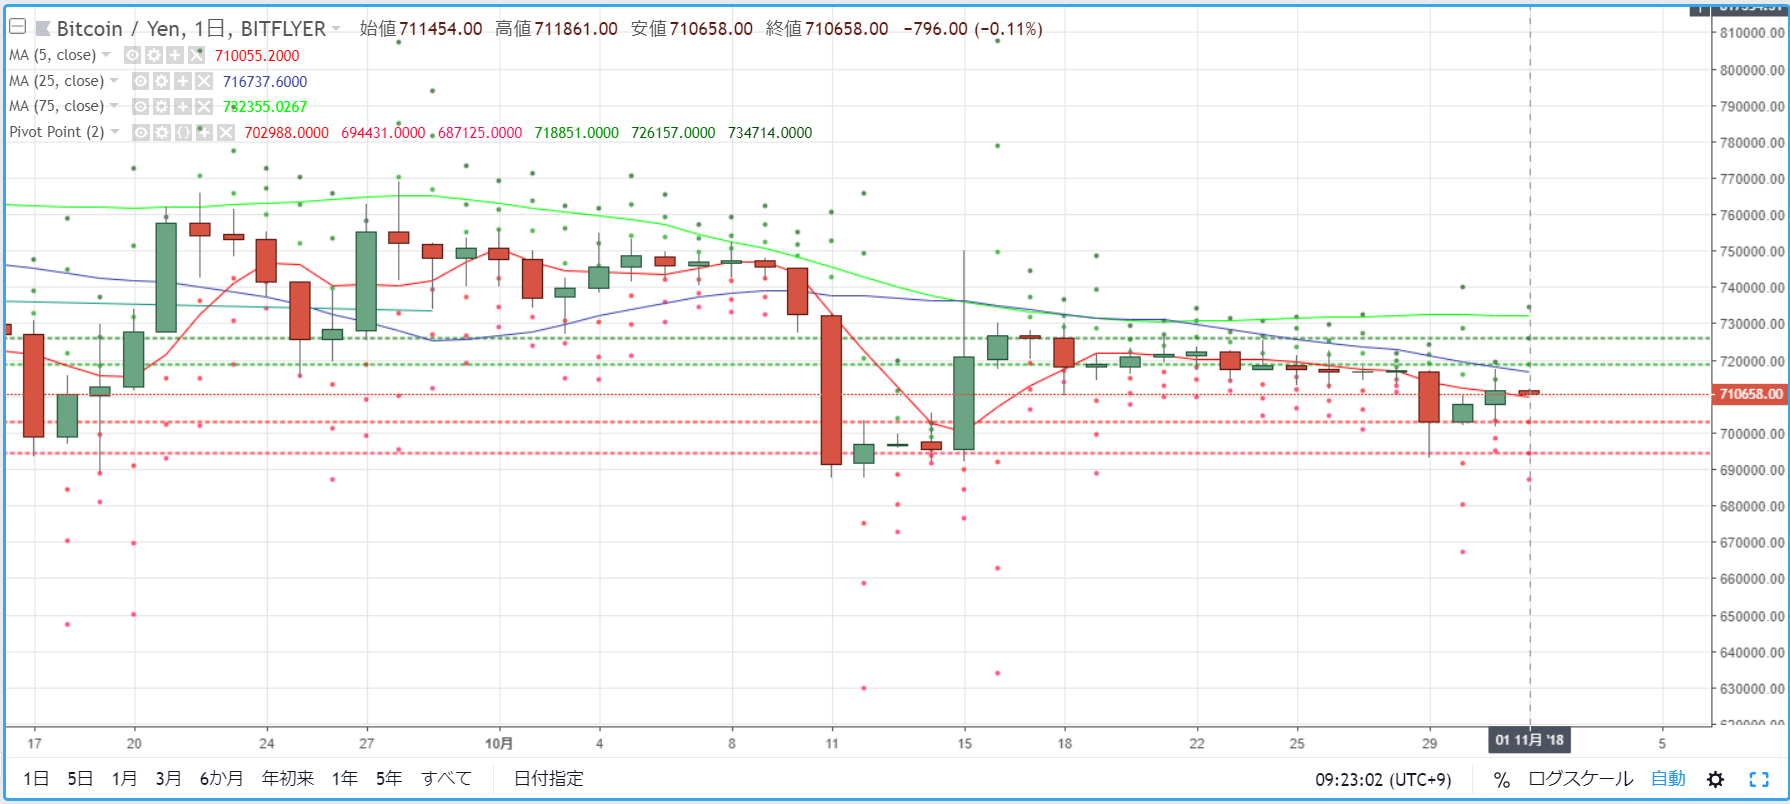
As a guide for day trading BTCJPY, we check the pivot. Yesterday (October 31) the price ranged from the high 700,000s to the mid 710,000s and formed a bullish candle. The price rose temporarily toward around the 25MA, but was pushed back and closed in that market environment.
R2=726,157
R1=718,851
S1=702,988
S2=694,431
※ A pivot is a technical indicator that predicts the price range for the day based on the previous day's price movement. Centered on the Pivot Point (PP), draw resistance lines (R1, R2) above and below and support lines (S1, S2) below, using them as trading benchmarks.
【Calculation Formula】
Pivot Point (PP) = (Previous day's closing price + Previous day's high price + Previous day's low price) / 3
Resistance Line 1 (R1) = PP + (PP - Previous day's low price)
Support Line 1 (S1) = PP - (Previous day's high price - PP)
Resistance Line 2 (R2) = PP + (Previous day's high price - Previous day's low price)
Support Line 2 (S2) = PP - (Previous day's high price - Previous day's low price)


