

【BTCJPY】20181031 Daily Pivot
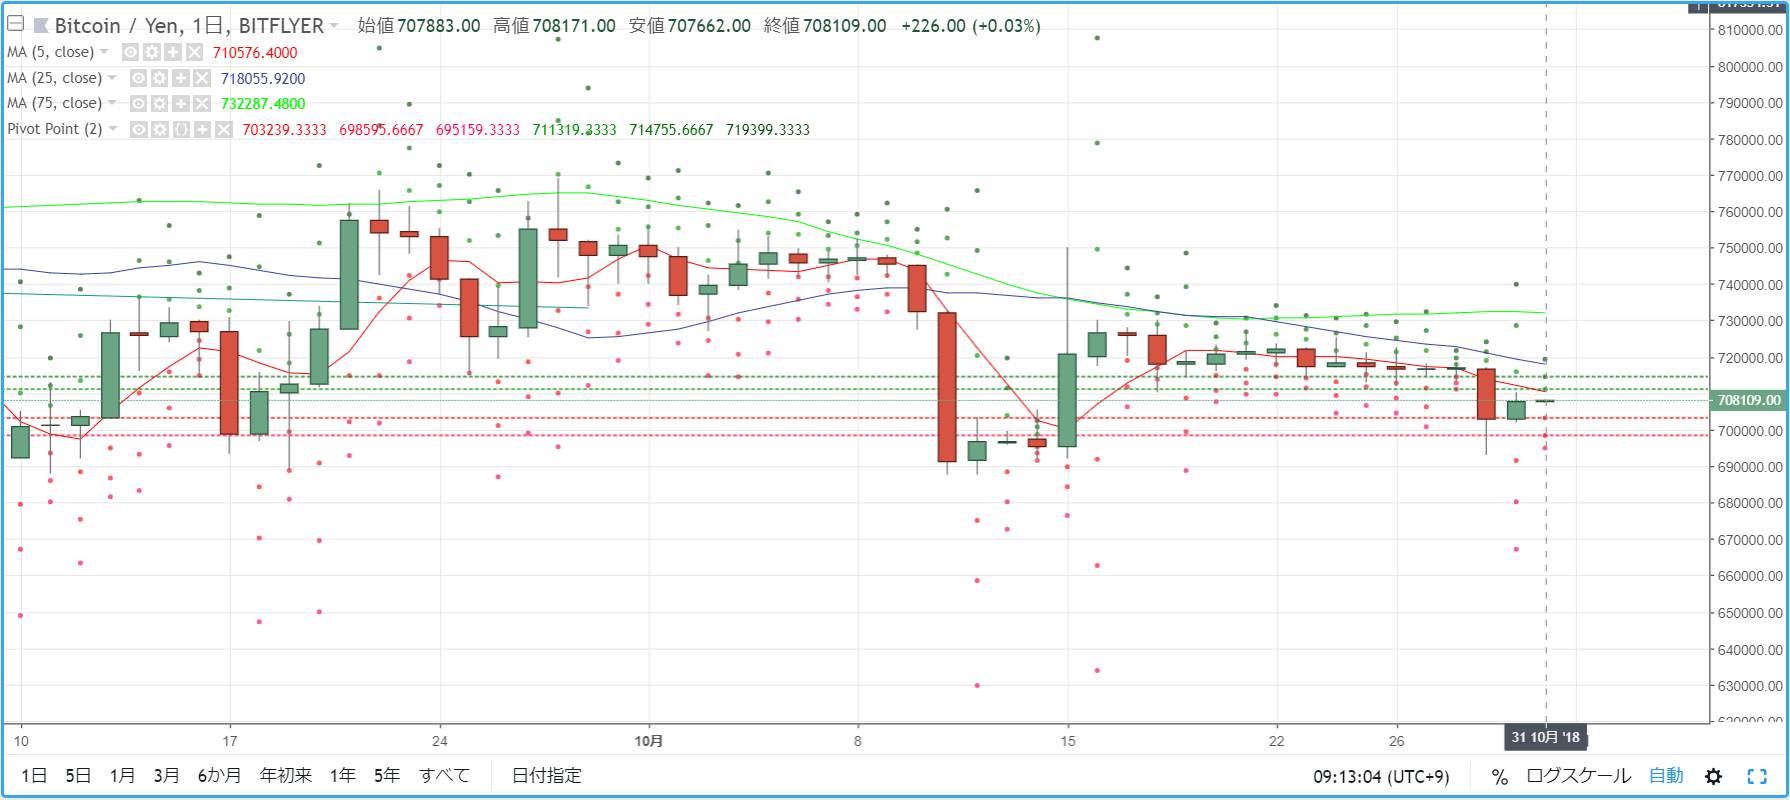
As a guide for day trading BTCJPY, we check the pivot. Yesterday (October 30) the momentum of buyers was strong and a bullish candle formed. The market environment was a rebound of about one-third of the drop from the day before.
R2=714,755
R1=711,319
S1=703,239
S2=698,595
※ A pivot point is a technical indicator that predicts the price movement for the current day based on the previous day's price action. Centered on the Pivot Point (PP), resistance lines (R1, R2) and support lines (S1, S2) are drawn above and below, and these are used as trading reference points.
【Calculation Formula】
Pivot Point (PP) = (yesterday's close + yesterday's high + yesterday's low) / 3
Resistance Line 1 (R1) = PP + (PP - yesterday's low)
Support Line 1 (S1) = PP - (yesterday's high - PP)
Resistance Line 2 (R2) = PP + (yesterday's high - yesterday's low)
Support Line 2 (S2) = PP - (yesterday's high - yesterday's low)


