
False Breakout and 2B Reversal and mBDSR (RCI2-band filter) Sell signal
Indicator that captures the bottom and reversal when combined with RCI: 【mBDSR】
Methods and case studies (PDF) ★GogoJungle AWARD2020 winner★
https://www.gogojungle.co.jp/tools/indicators/11836
The above products include 301 PDFs. For a list of the PDF titles, please see the article below.
About the 301 PDF files attached to 【BODSOR・mBDSR】
https://www.gogojungle.co.jp/finance/navi/articles/34271
NZD/USD – 30-minute chart
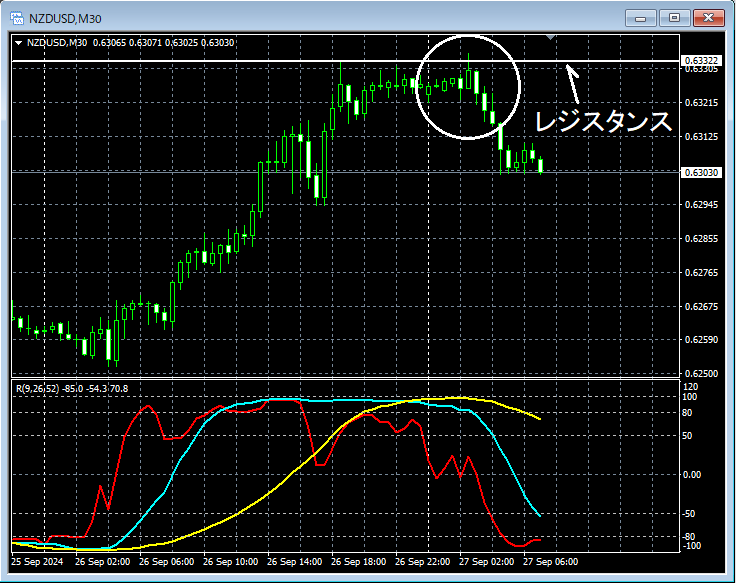
Looking at the area circled in white on the 30-minute chart above,Resistanceis briefly broken but rejected by the shadows, and more importantly, a signal suggesting a decline2B Reversal (Two-Barrier Reversal)appears.False Breakoutcould also be possible, and it may be reasonable to look for a sell on the lower timeframe. We will carefully monitor for signs of a downward move on the lower timeframe.
NZD/USD – 5-minute chart
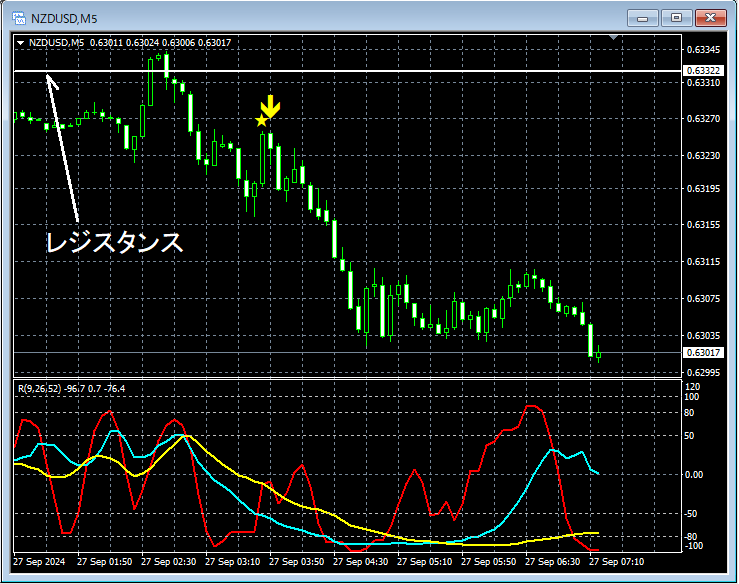
On the 5-minute chart above, after the2B Reversal (Two-Barrier Reversal)appears on the 30-minute chart,mBDSR (two-RCI lines filter) sell signallights up, and the price subsequently declines firmly.
From this example,a trading method focusing on False Breakouts and 2B Reversalsandthe compatibility with mBDSR signalsare evident.
Indicator that is powerful in combination with RCI: 【BODSOR・mBDSR】
Methods and case studies (PDF) ★GogoJungle AWARD2020 winner★
https://www.gogojungle.co.jp/tools/indicators/11836
The PDF files total 301 (over 1,000 pages, over 350,000 characters).
Many of them illustrate a method that logically links higher and lower timeframes using three RCI lines, sequentially considering multiple lower-timeframe conditions, and ultimately waiting for a pullback buy or a return-sell timing on the lower timeframes (i.e., the mBDSR signals).Furthermore,
many emphasize identifying points where multiple entry reasons overlap.There are many such examples.
In the explanations,more than 1,000 chartsare used.

Methods and case studies (PDF) ★GogoJungle AWARD2020 winner★
https://www.gogojungle.co.jp/tools/indicators/11836
The above products include 301 PDFs. For a list of the PDF titles, please see the article below.
About the 301 PDF files attached to 【BODSOR・mBDSR】
https://www.gogojungle.co.jp/finance/navi/articles/34271
NZD/USD – 30-minute chart
Looking at the area circled in white on the 30-minute chart above,Resistanceis briefly broken but rejected by the shadows, and more importantly, a signal suggesting a decline2B Reversal (Two-Barrier Reversal)appears.False Breakoutcould also be possible, and it may be reasonable to look for a sell on the lower timeframe. We will carefully monitor for signs of a downward move on the lower timeframe.
NZD/USD – 5-minute chart
On the 5-minute chart above, after the2B Reversal (Two-Barrier Reversal)appears on the 30-minute chart,mBDSR (two-RCI lines filter) sell signallights up, and the price subsequently declines firmly.
From this example,a trading method focusing on False Breakouts and 2B Reversalsandthe compatibility with mBDSR signalsare evident.
Indicator that is powerful in combination with RCI: 【BODSOR・mBDSR】
Methods and case studies (PDF) ★GogoJungle AWARD2020 winner★
https://www.gogojungle.co.jp/tools/indicators/11836
The PDF files total 301 (over 1,000 pages, over 350,000 characters).
Many of them illustrate a method that logically links higher and lower timeframes using three RCI lines, sequentially considering multiple lower-timeframe conditions, and ultimately waiting for a pullback buy or a return-sell timing on the lower timeframes (i.e., the mBDSR signals).Furthermore,
many emphasize identifying points where multiple entry reasons overlap.There are many such examples.
In the explanations,more than 1,000 chartsare used.