

【BTCJPY】20181030 Daily Pivot
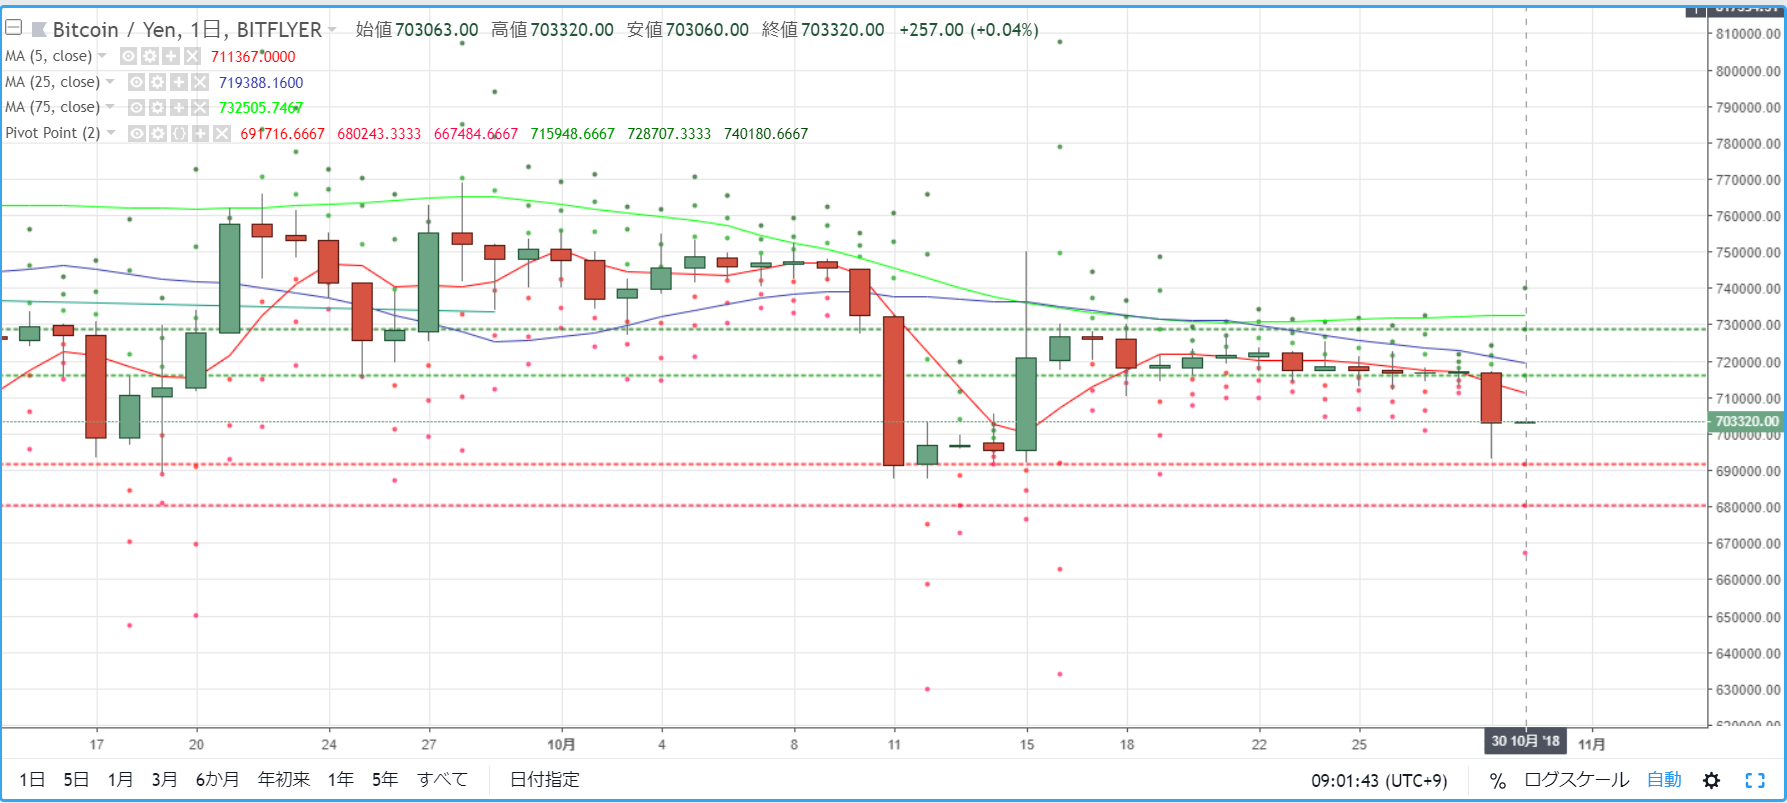
As a guideline for day trading BTCJPY, we confirm the pivot. Yesterday (October 29) moved significantly for the first time in a while, forming a strong bearish candle. It broke below the 5MA, briefly fell to the early 690,000s, but then recovered to the early 700,000s and closed in that market environment.
R2=728,707
R1=715,948
S1=691,716
S2=680,243
※ Pivot points are technical indicators that estimate the price movement for the day based on the previous day's activity. Pivot points (PP) are used as the center, with resistance lines (R1, R2) upward and downward, and support lines (S1, S2) drawn in order to guide trading decisions.
【Calculation Formulas】
Pivot Point (PP) = (Previous Day's Close + Previous Day's High + Previous Day's Low) / 3
Resistance Line 1 (R1) = PP + (PP - Previous Day's Low)
Support Line 1 (S1) = PP - (Previous Day's High - PP)
Resistance Line 2 (R2) = PP + (Previous Day's High - Previous Day's Low)
Support Line 2 (S2) = PP - (Previous Day's High - Previous Day's Low)


