
Horizontal line & Bollinger Bands|Expansion Detection Indicator <Past Verification Mode>
Good evening, it is Aime.
Today is Friday! And from tomorrow, it’s a three-day weekend♪
It’s still hot and humid these days, but
I’m planning to go to my parents’ house tomorrow.
My father has his birthday today, so we’ve promised to get together as a family and drink tomorrow.
My father enjoys walking and used to go to a large park in the neighborhood almost every day, but he hasn’t been able to walk for the past few weeks due to this heat. I’ve been a little worried, so I plan to go and check on him lol
Well then—
today is a continuation of theprevious article.
This is about the tool used for environmental recognition.
In the environmental recognition articles, you may have seen, I’m displaying a chart with a Bollinger Band expansion detection tool.
The base is an indicator that draws horizontal lines, but I’ve also made a few changes to the drawing of the horizontal lines. In addition to the highest and lowest values, horizontal lines are drawn, and I’ve made it so horizontal lines are drawn for all peak and trough points. In the previous version, horizontal lines were drawn only where two or more peak/trough points overlapped.
Now, tonight I will explain the “backtest mode.”
Common indicators, such as moving averages and Bollinger Bands, determine a single value or signal for the chart’s horizontal axis (time axis), but the horizontal line drawing indicator I provide determines, for each unit of the chart’s horizontal axis (time axis), one set of a horizontal line (the highest/lowest value) and a certain period’s shape, so what the indicator displays depends on which part of the chart’s horizontal axis you focus on.
In Type 1 indicators, I used to draw only the situation relative to the latest price, but with backtest mode you can verify what the indicator’s shape would have been at a certain past time, and how you should judge with horizontal lines where the rise began.
First, let’s see how it works.
I recorded a video during the day. It’s not a perfect scenario (a time when a trend is starting), but I hope you’ll check the indicator’s behavior.
<Possible operations>
1. Mouse click: You can directly specify the position of the horizontal line to be drawn.
2. Keyboard operation: You can move the position of the drawn horizontal lines left and right.
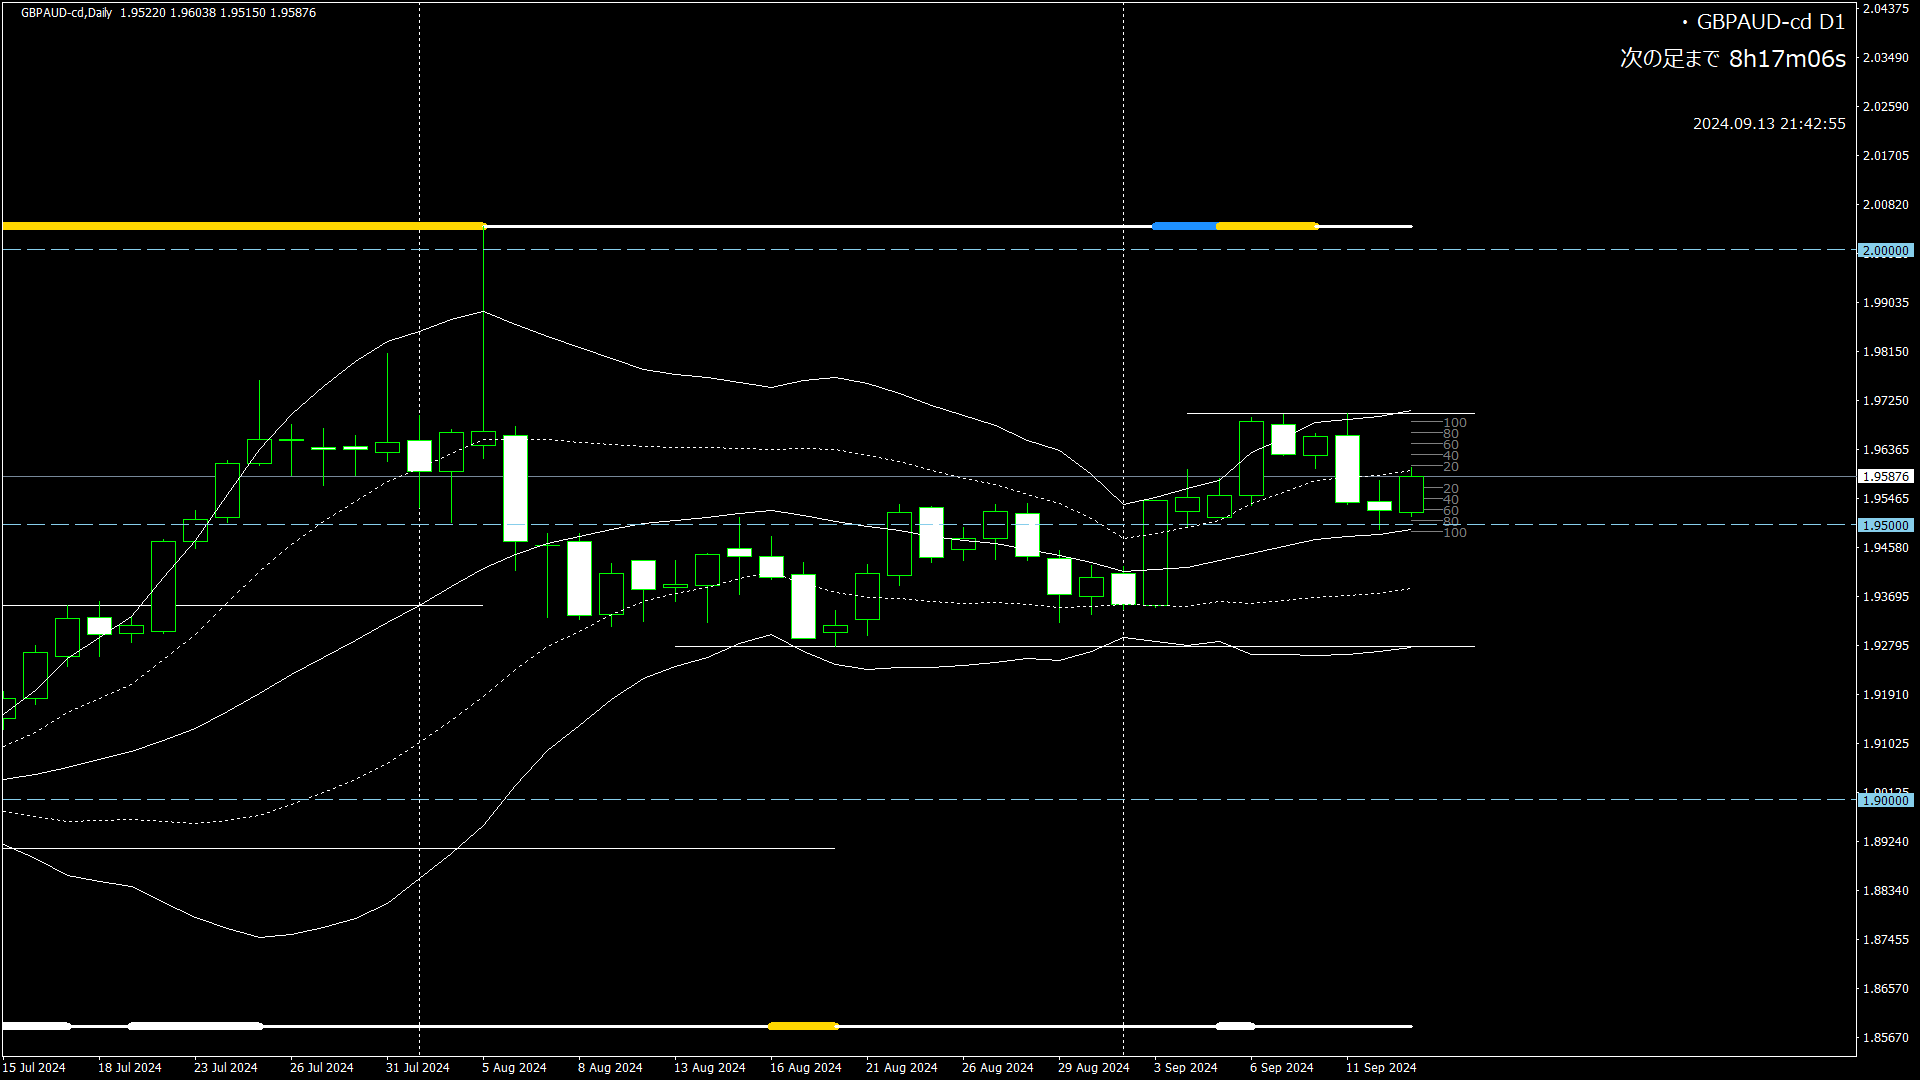
<Display of expansion>
The highest value and the lowest value lines are normally displayed in white.
When an expansion occurs, the color changes as follows.
Standard deviation 1 and 2, if expansion occurs → yellow
Only standard deviation 1 expands → red
Only standard deviation 2 expands → blue
When there is no expansion → white
>>> To the previous article
That is all.
Have a great weekend!