
From yesterday's Euro-Yen chart (August 29, 2024): on the high of the day and a short signal using the mBDSR (RCI2-filter) retracement
Indicator that captures “tops/bottoms and reversals” in combination with RCI: 【mBDSR】
Methods, case studies (PDF) ★GogoJungle AWARD2020 Winner★
https://www.gogojungle.co.jp/tools/indicators/11836
The above product includes 301 PDFs. For a list of their titles and other details, please see the article below.
About the 301 PDF files included with 【BODSOR・mBDSR】
https://www.gogojungle.co.jp/finance/navi/articles/34271
EURJPY 15-minute chart
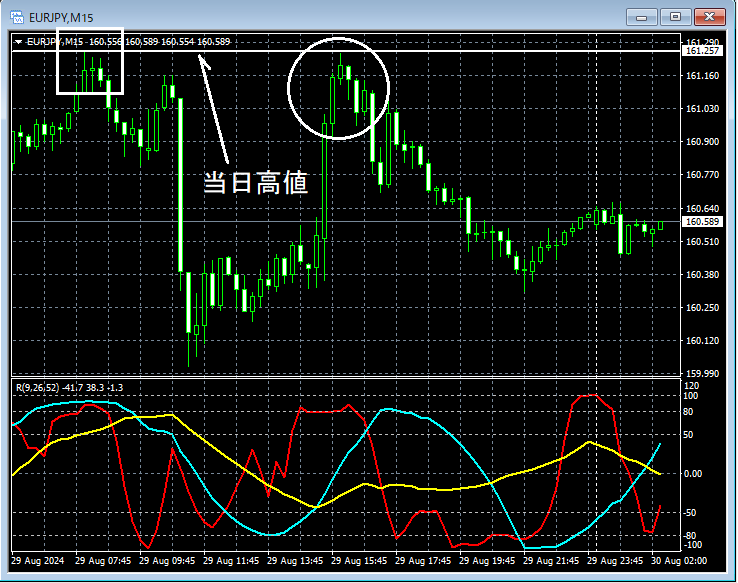
Looking at the 15-minute chart above,the line indicating the intraday high (horizontal line)has risen close to that area. If this line is perceived as resistance, it might be a scene where selling on pullbacks is not unreasonable. We will carefully watch for signs of rejection on lower timeframes.
EURJPY 5-minute chart
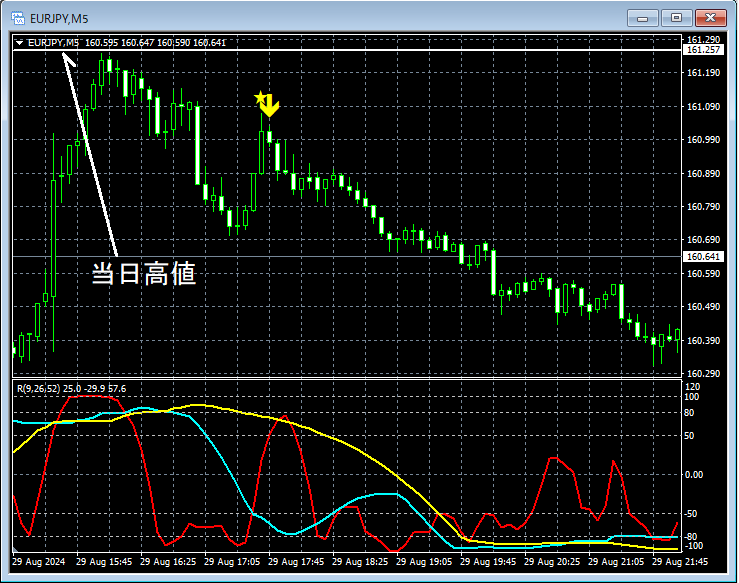
Looking at the 5-minute chart above,the line indicating the intraday highrejected nearby,mBDSR (two RCI filters) sell signallit up, and the price moved further down.
From this example,a trading method focusing on the intraday high (horizontal line)andthe signal of mBDSRshow a strong compatibility.
Indicator that shines in combination with RCI: 【BODSOR・mBDSR】
Methods, case studies (PDF) ★GogoJungle AWARD2020 Winner★
https://www.gogojungle.co.jp/tools/indicators/11836
The PDF files include 301 items (over 1,000 pages, over 350,000 characters in total).
Many of them explain a method that links higher and lower timeframes logically using three RCI lines, then examines multiple lower-timeframe conditions step by step, ultimately waiting for pullbacks or pullbacks timing on lower timeframes (i.e., mBDSR signals)..
Additionally,many emphasize identifying points where multiple entry reasons overlap..
The explanations usemore than 1,000 charts..

Methods, case studies (PDF) ★GogoJungle AWARD2020 Winner★
https://www.gogojungle.co.jp/tools/indicators/11836
The above product includes 301 PDFs. For a list of their titles and other details, please see the article below.
About the 301 PDF files included with 【BODSOR・mBDSR】
https://www.gogojungle.co.jp/finance/navi/articles/34271
EURJPY 15-minute chart
Looking at the 15-minute chart above,the line indicating the intraday high (horizontal line)has risen close to that area. If this line is perceived as resistance, it might be a scene where selling on pullbacks is not unreasonable. We will carefully watch for signs of rejection on lower timeframes.
EURJPY 5-minute chart
Looking at the 5-minute chart above,the line indicating the intraday highrejected nearby,mBDSR (two RCI filters) sell signallit up, and the price moved further down.
From this example,a trading method focusing on the intraday high (horizontal line)andthe signal of mBDSRshow a strong compatibility.
Indicator that shines in combination with RCI: 【BODSOR・mBDSR】
Methods, case studies (PDF) ★GogoJungle AWARD2020 Winner★
https://www.gogojungle.co.jp/tools/indicators/11836
The PDF files include 301 items (over 1,000 pages, over 350,000 characters in total).
Many of them explain a method that links higher and lower timeframes logically using three RCI lines, then examines multiple lower-timeframe conditions step by step, ultimately waiting for pullbacks or pullbacks timing on lower timeframes (i.e., mBDSR signals)..
Additionally,many emphasize identifying points where multiple entry reasons overlap..
The explanations usemore than 1,000 charts..