Nikkei, Nasdaq, and S&P 500 declines and surges
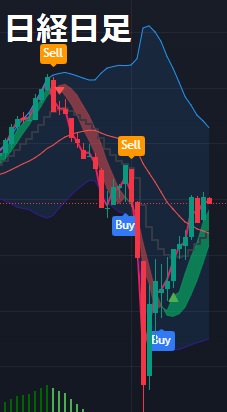
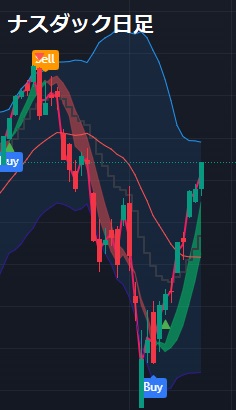
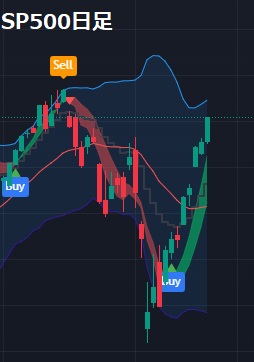
It's late, but the signs of a top and bottom for Nikkei, NASDAQ, and SP have appeared on the daily chart.
This time I was in a hurry and couldn't enter, so I made a regrettable decision.
On July 11, the Nikkei and Nasdaq reached a top and Sell appeared the next day.
After that, on July 16, SP topped and Sell appeared on that day.
Nikkei and Nasdaq continued to fall until July 25, and after a brief rebound they fell again and plummeted on Monday, August 2, then rose.
Even if you had shorted, it would have been quite difficult to hold until August 2, so I think I would have closed after the 25th. It’s not something you’d expect, that a huge crash would come after that.
Looking back, it would have been better to go long during the August 2 crash, but at the time I thought it would fall further, so I couldn't do it out of fear.
After that, on August 8, a Buy signal appeared, so it would have been good to go long then.
Indicator that can identify tops and bottoms
With this indicator, it can be used not only for FX, but also for Nikkei, Dow, Nasdaq, SP, Gold, Crude Oil, Bitcoin, etc., so please consider it.