

【BTCJPY】20181023 Daily Pivot
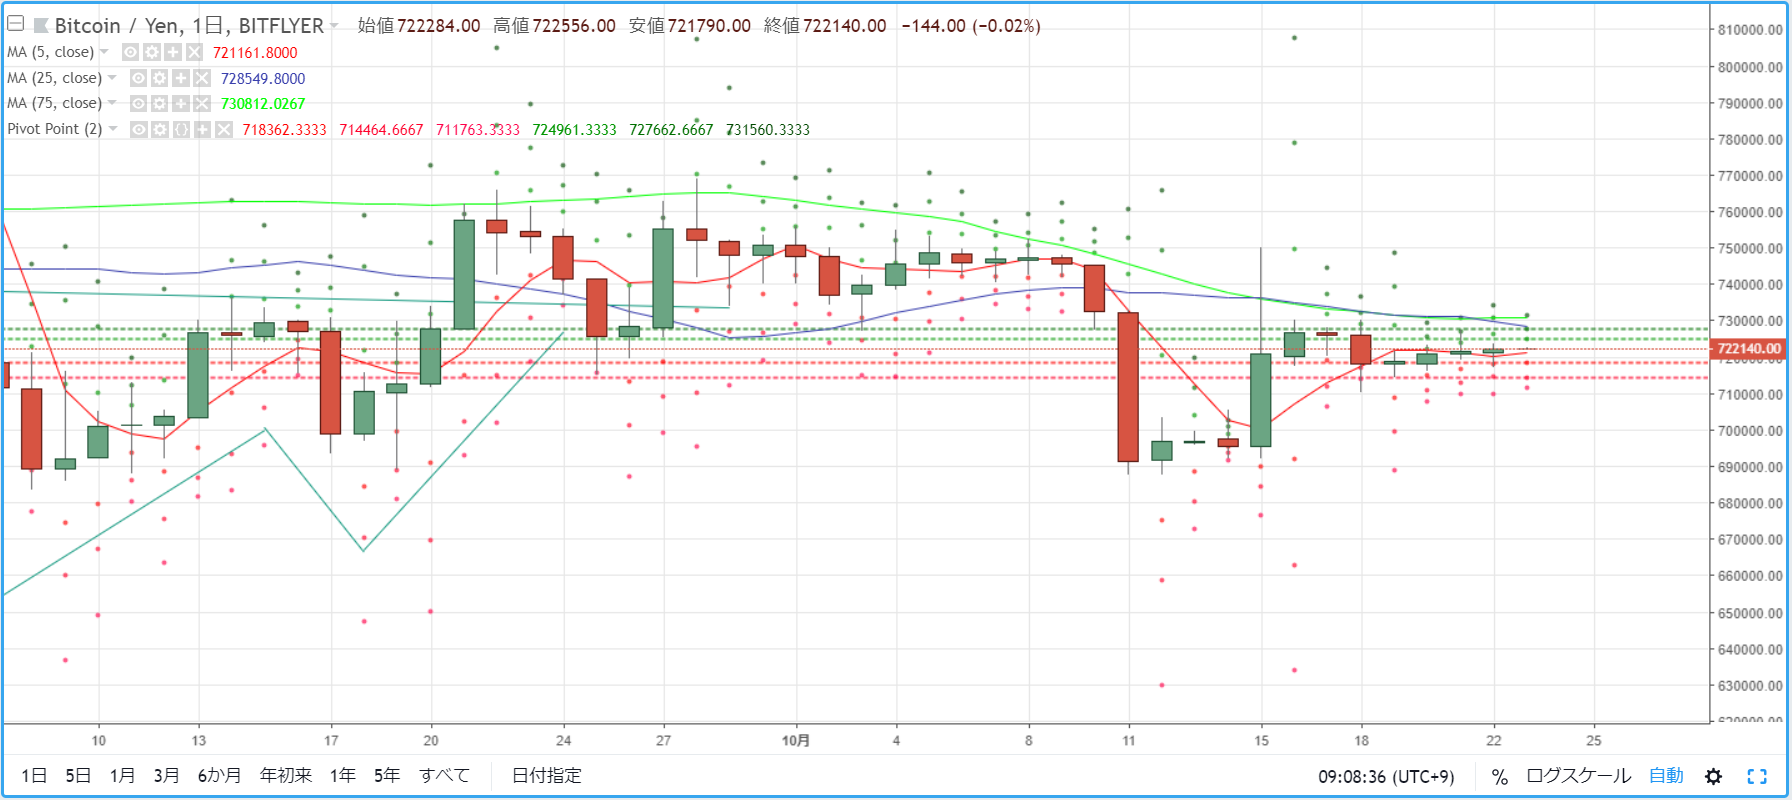
As a guideline for day trading BTCJPY, we check the pivot. Yesterday (October 22) also saw only small price movements, trading in the late 710,000 yen range to early 720,000 yen range. Throughout, it was a calm market environment.
R2=727,662
R1=724,961
S1=718,362
S2=714,464
* A pivot point is a technical indicator that forecasts the potential price movement for the current day based on the previous day's movement. Centered on the Pivot Point (PP), draw resistance lines (R1, R2) above and below, and support lines (S1, S2) to use as trading references.
[Calculation Formula]
Pivot Point (PP) = (Previous day's close + previous day's high + previous day's low) / 3
Resistance Line 1 (R1) = PP + (PP - previous day's low)
Support Line 1 (S1) = PP - (previous day's high - PP)
Resistance Line 2 (R2) = PP + (previous day's high - previous day's low)
Support Line 2 (S2) = PP - (previous day's high - previous day's low)


