

【BTCJPY】20181019 Daily Pivot
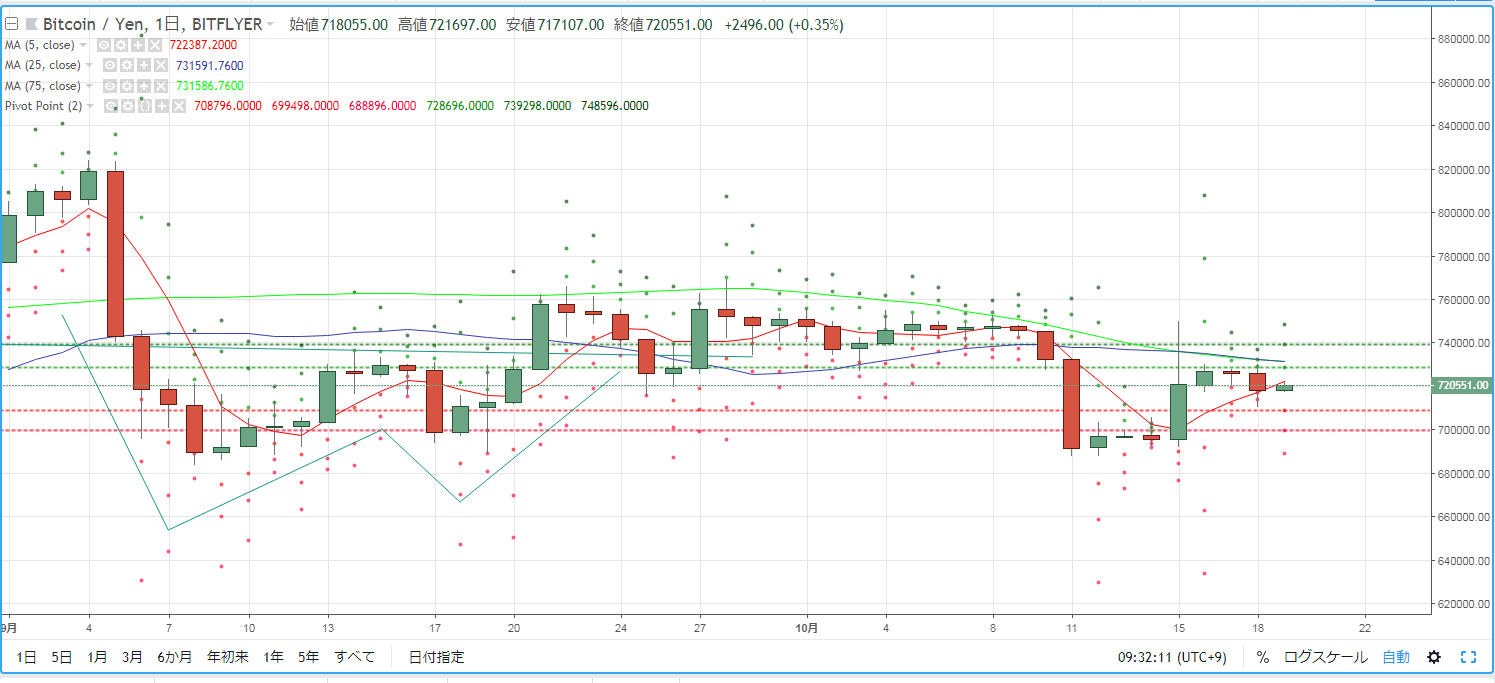
As a guideline for day trading BTCJPY, we verify the pivot. Yesterday (October 18) was dominated by selling and formed a bearish candlestick. The market environment closed in the upper 700,000 yen range where 5MA sits.
R2=739,298
R1=728,696
S1=708,796
S2=699,498
* A pivot is a technical indicator that forecasts the day's price movement based on the previous day's activity. Centered on the Pivot Point (PP), we draw resistance lines (R1, R2) above and below, and support lines (S1, S2) below, using them as trading references.
【Calculation Formula】
Pivot Point (PP) = (Previous day's close + high + low) / 3
Resistance Line 1 (R1) = PP + (PP - Previous day's low)
Support Line 1 (S1) = PP - (Previous day's high - PP)
Resistance Line 2 (R2) = PP + (Previous day's high - Previous day's low)
Support Line 2 (S2) = PP - (Previous day's high - Previous day's low)


