

【BTCJPY】20181018 Daily Pivot
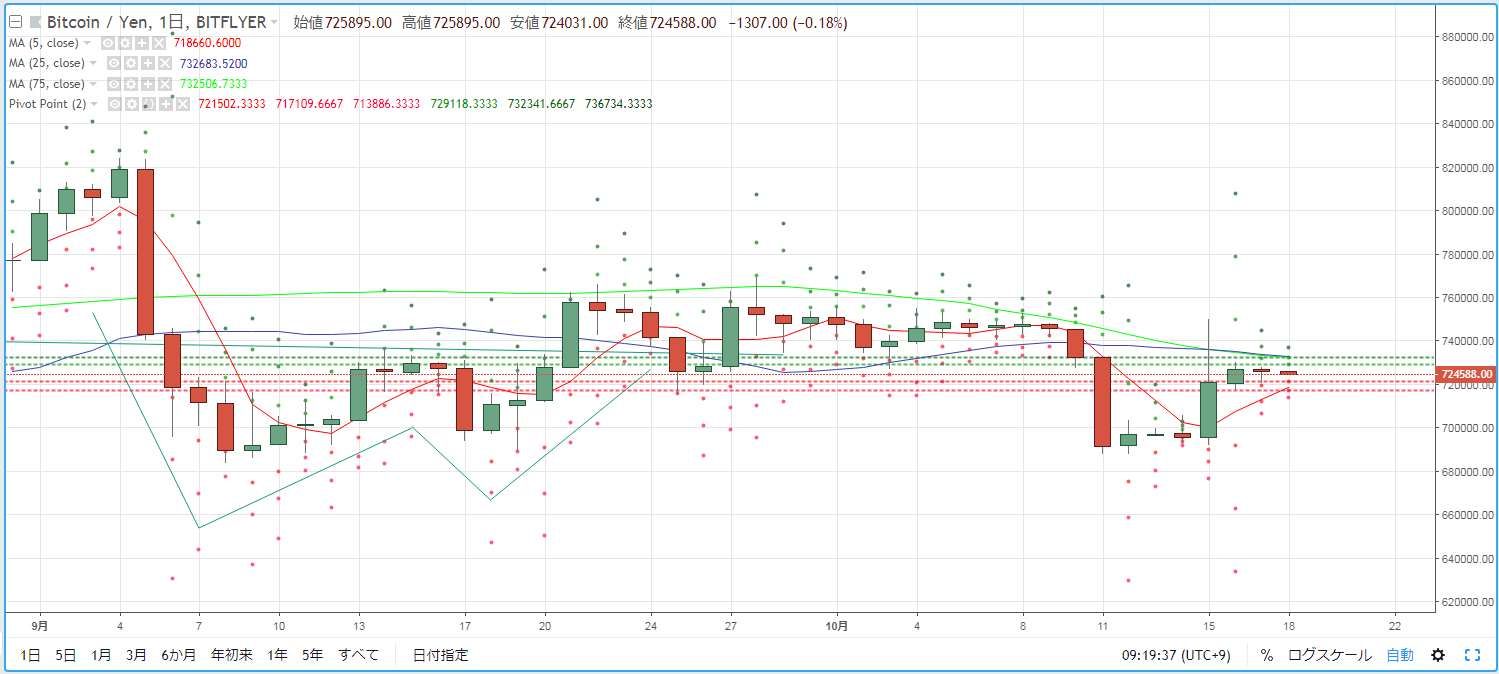
As a guideline for day trading BTCJPY, we check the pivot. Yesterday (October 17) it traded around the 7,200,000 yen mark. The market had no clear direction and traded in a narrow range.
The market was directionless and ended with little movement.
R2=732,341
R1=729,118
S1=721,502
S2=717,109
※ A pivot is a technical indicator that forecasts the potential price movement for the day based on the previous day's price action. By centering on the Pivot Point (PP), draw resistance lines (R1, R2) and support lines (S1, S2) above and below, and use them as trading references.
【Calculations】
Pivot Point (PP) = (previous day close + previous day high + previous day low) / 3
Resistance Line 1 (R1) = PP + (PP - previous day low)
Support Line 1 (S1) = PP - (previous day high - PP)
Resistance Line 2 (R2) = PP + (previous day high - previous day low)
Support Line 2 (S2) = PP - (previous day high - previous day low)


