

[BTCJPY] 20181016 Daily Pivot
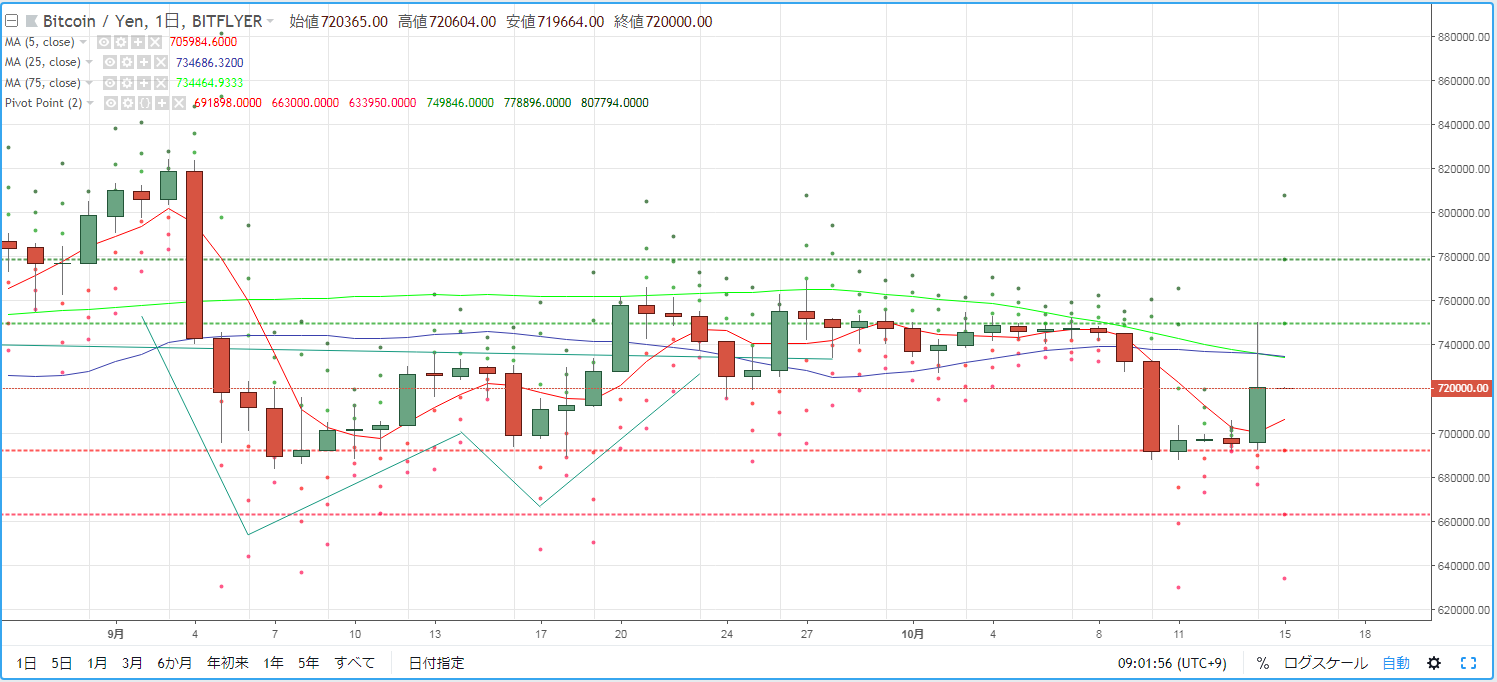
As a guideline for day trading BTCJPY, we check the pivot. Yesterday (October 15) it surged briefly into the upper 740,000s but soon reversed and fell. The market environment formed a bullish candle with a long upper wick.
R2=778,896
R1=749,846
S1=691,898
S2=663,000
※ A pivot is a technical indicator that predicts the price movement range for the current day based on previous day’s price action. Centered on the Pivot Point (PP), draw resistance lines (R1, R2) and support lines (S1, S2) above and below, using them as trading guides.
【Calculation formula】
Pivot Point (PP) = (previous day's close + previous day's high + previous day's low) / 3
Resistance Line 1 (R1) = PP + (PP - previous day's low)
Support Line 1 (S1) = PP - (previous day's high - PP)
Resistance Line 2 (R2) = PP + (previous day's high - previous day's low)
Support Line 2 (S2) = PP - (previous day's high - previous day's low)


