

【BTCJPY】20181012 Daily Pivot
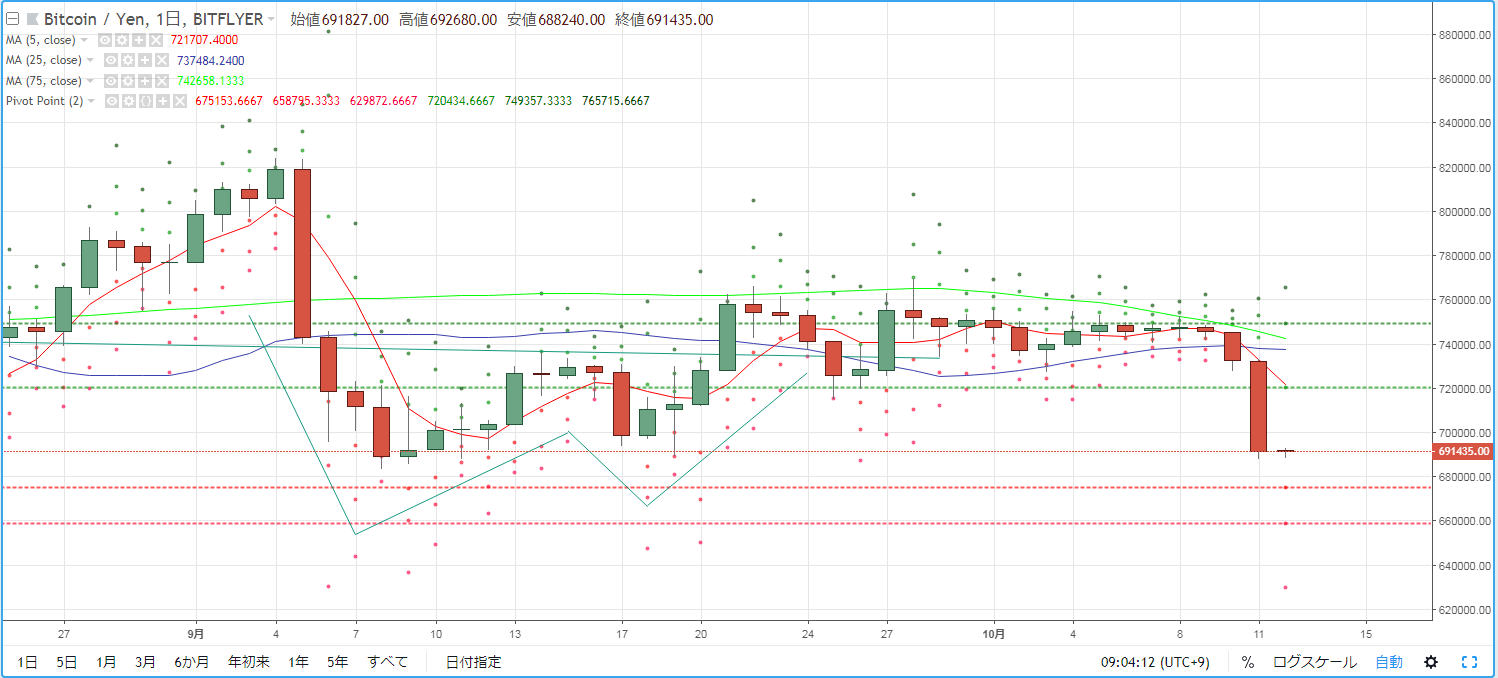
Using BTCJPY for intraday trading as a guideline, we check the pivot. Yesterday (October 11) the selling momentum accelerated further, forming a long bearish candlestick for the first time in a while. It fell below 700,000 yen and closed in the early 690,000s, indicating a bearish market environment.
R2=749,357
R1=720,434
S1=675,153
S2=658,795
※ Pivot is a technical indicator that estimates price movement for the day based on the prior day's price action. Centered on the Pivot Point (PP), draw resistance lines (R1, R2) above and below, and support lines (S1, S2) below, using them as trading guidelines.
【Calculation Formula】
Pivot Point (PP) = (Previous day close + previous day high + previous day low) / 3
Resistance Line 1 (R1) = PP + (PP - previous day low)
Support Line 1 (S1) = PP - (previous day high - PP)
Resistance Line 2 (R2) = PP + (previous day high - previous day low)
Support Line 2 (S2) = PP - (previous day high - previous day low)


