

【BTCJPY】20181011 Daily Pivot
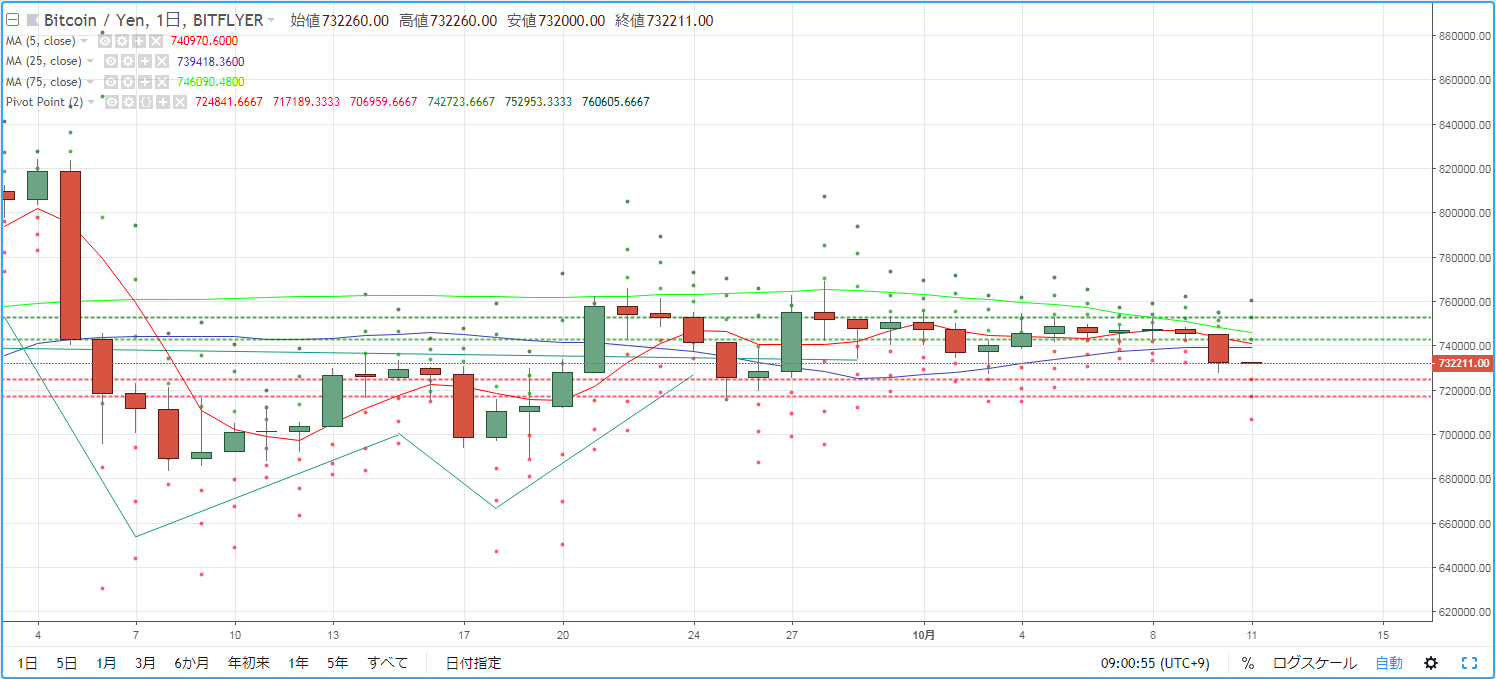
As a guideline for day trading BTCJPY, we verify the pivot. Yesterday (October 10) there was selling pressure and a bearish candle formed. Not only the 5MA but also the 25MA were broken to the downside, and the market environment fell to the early 7,270,000-7,300,000 JPY range.
R2=752,953
R1=742,723
S1=724,841
S2=717,189
※ A pivot is a technical indicator that predicts the day's price movement based on the previous day's price action. Centered on the Pivot Point (PP), draw resistance lines (R1, R2) above and below, and support lines (S1, S2) below, and use them as trading guidelines.
【Calculation】
Pivot Point (PP) = (Previous day's close + previous day's high + previous day's low) / 3
Resistance Line 1 (R1) = PP + (PP - previous day's low)
Support Line 1 (S1) = PP - (previous day's high - PP)
Resistance Line 2 (R2) = PP + (previous day's high - previous day's low)
Support Line 2 (S2) = PP - (previous day's high - previous day's low)


