

Old v7: One-click FX Training MAX support page
This page is a past version. The latest version is here,
https://www.gogojungle.co.jp/finance/navi/articles/45688
Thank you for purchasing this product.
The latest version is 7.60.
Upgrades for purchasers are free ⇒Download
https://www.gogojungle.co.jp/tools/indicators/22485
Product Contents
One-Click FX Training MAX is a Forex trading practice tool that lets you practice discretionary trading even on weekends when the market is closed. You can practice anytime 24/7/365 whenever you notice it.
In addition to basic features such as speed adjustment, limit orders, and automatic setting of stop and take-profit, it includes replay functionality and signal tool integration &One-Click Auto Arw Trade, partial close, automatic calculation, history saving, image saving, and rich display features, making it a fully functional practice tool.
From daily practice to tool verification and technical analysis, it can be used for various purposes.
Version Upgrade Information
Added Next Bar button
▼ October 20, 2023 v7.51
Added color to close messages,
Clicking on historical dates shows results
Other bug fixes
▼ September 29, 2023 v7.50
Supported One-Click Auto Arw Trade
Added sell/buy settlements to signal integration
Changed display of profit and loss in history by P/L size
Speed up signal integration
Added credits to P/L calculation
Added initial handling to server orders
Changed minimum RR to 0.1
Added execution point to TP/SL line display
Added parameter for initial position of the control box
Automatic generation of active synchronized charts
▼ April 22, 2023 v7.30
ASP comment corrections
▼ April 12, 2023 v7.281
Activation of synchronized charts
Save button for standard charts
Elimination of choppiness in the position bar
Display, comments, etc. corrections
▼ March 11, 2023 v7.11
Added WebRequest to license authentication,
Addressed ASP restrictions,
Auto average-numbering button
Font size scaling
Added speed list
Supports multiple signals,
Notifications to Slack
2022-09-16 v7.010 bug fixes, etc.
▼ September 04, 2022 v7
Added limit order entries
Added automatic calculation of risk
Added P/L percentage (risk %) for margin
Daily P/L percentage display, trade history display
Display of position information
Added risk-reward
Changed display of position triangles
Auto-save of daily summary images
Right-edge shift for synchronized charts
Added calculation for risk %
▼ April 16, 2022
TP/SL/TS reset flag added on all settlements
Fixed NONE triangle bug, etc.
▼ October 15, 2021 v6
Immediate display of position at entry
Added invalid values for tool control TP/SL
Reject entry when negative
Added LINE, Discard notifications
Changed triangle color to intermediate between BUY/SELL
Added initial value parameters
Added message display area for errors, executions, etc.
Reduced load during speed control
Supports accounts with some fees
▼ June 2, 2021
Added forced loss-cut line
Preventing the settings screen from appearing when repeatedly tapping
TP/SL line drag-and-drop support
Added sub-panel
Added individual settlements and partial settlements
Supports active standard chart changes
Added compact mode
Added parameter for signal integration (index)
Added close for signal integration objects
Included free version of signal integration indicator
ON/OFF toggle for signal integration
Added license authentication
▼ August 8, 2020 additions
Signal tool integration
Automatic saving of trade images
Change control box color to your preference
Break-even line
TP, SL lines
Change notation to PIPS
Organizing parameters
PipsGrid bundle drawing lines in PIPS units
Position display in synchronized charts
SL standard and trail
Auto averaging with SL
Line at specified percentage of funds
▼ May 25 additions
Pseudo ASK lines for quick profit/loss understanding
Auto on/off for auto trail
▼ May 1 additions
Disable TP/SL at 0 on order
Enable trailing on take-profit order for profit maximization
Add PIPS display for profit/loss
Show losses in red
Add currency name to P/L ALL and RESULT
▼ March 27
Show current spread (including real version)
Display a triangle for limit and stop orders for positions
Add limit and stop orders to tool control (including real version)
Add MA, BB, SAR to trailing stop
Add time offset and daylight saving settings to time display
Synchronize scaling with other charts
Add dedicated templates
*This page also contains images before version upgrades
How to Install
The source of distribution does not matter, so please install the MT4 you prefer.
Note: Using the same environment may cause unexpected problems, so we recommend preparing a separate MT4 and trading account from your usual trading setup.
Please check the DLL usage permission (details arehere)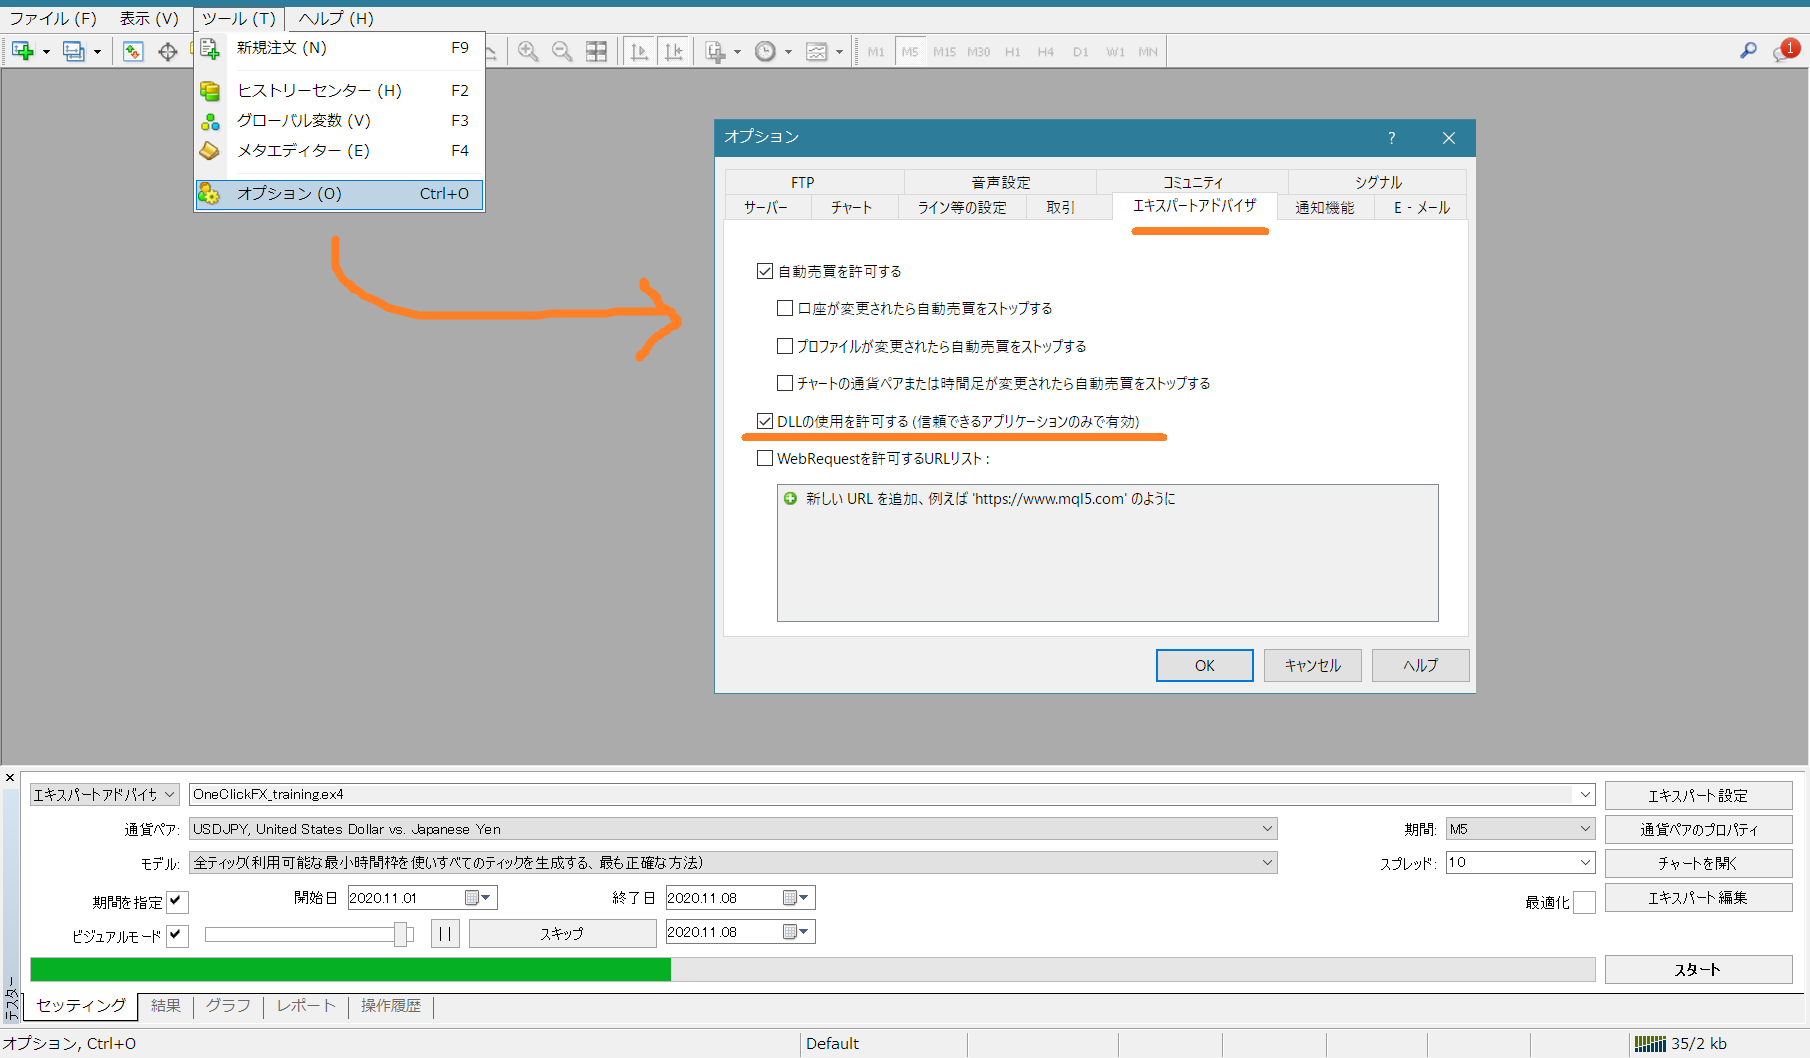
Preparation for Authentication
This will be added to WebRequest. If you experience authentication issues due to security tools, please adjust the settings.
In the MT4 menu, select Tools -> Options, then open the Expert Advisors dialog.
Check the URL list to allow WebRequest and add the new URL “https://license.ioiv.net/”, then click OK.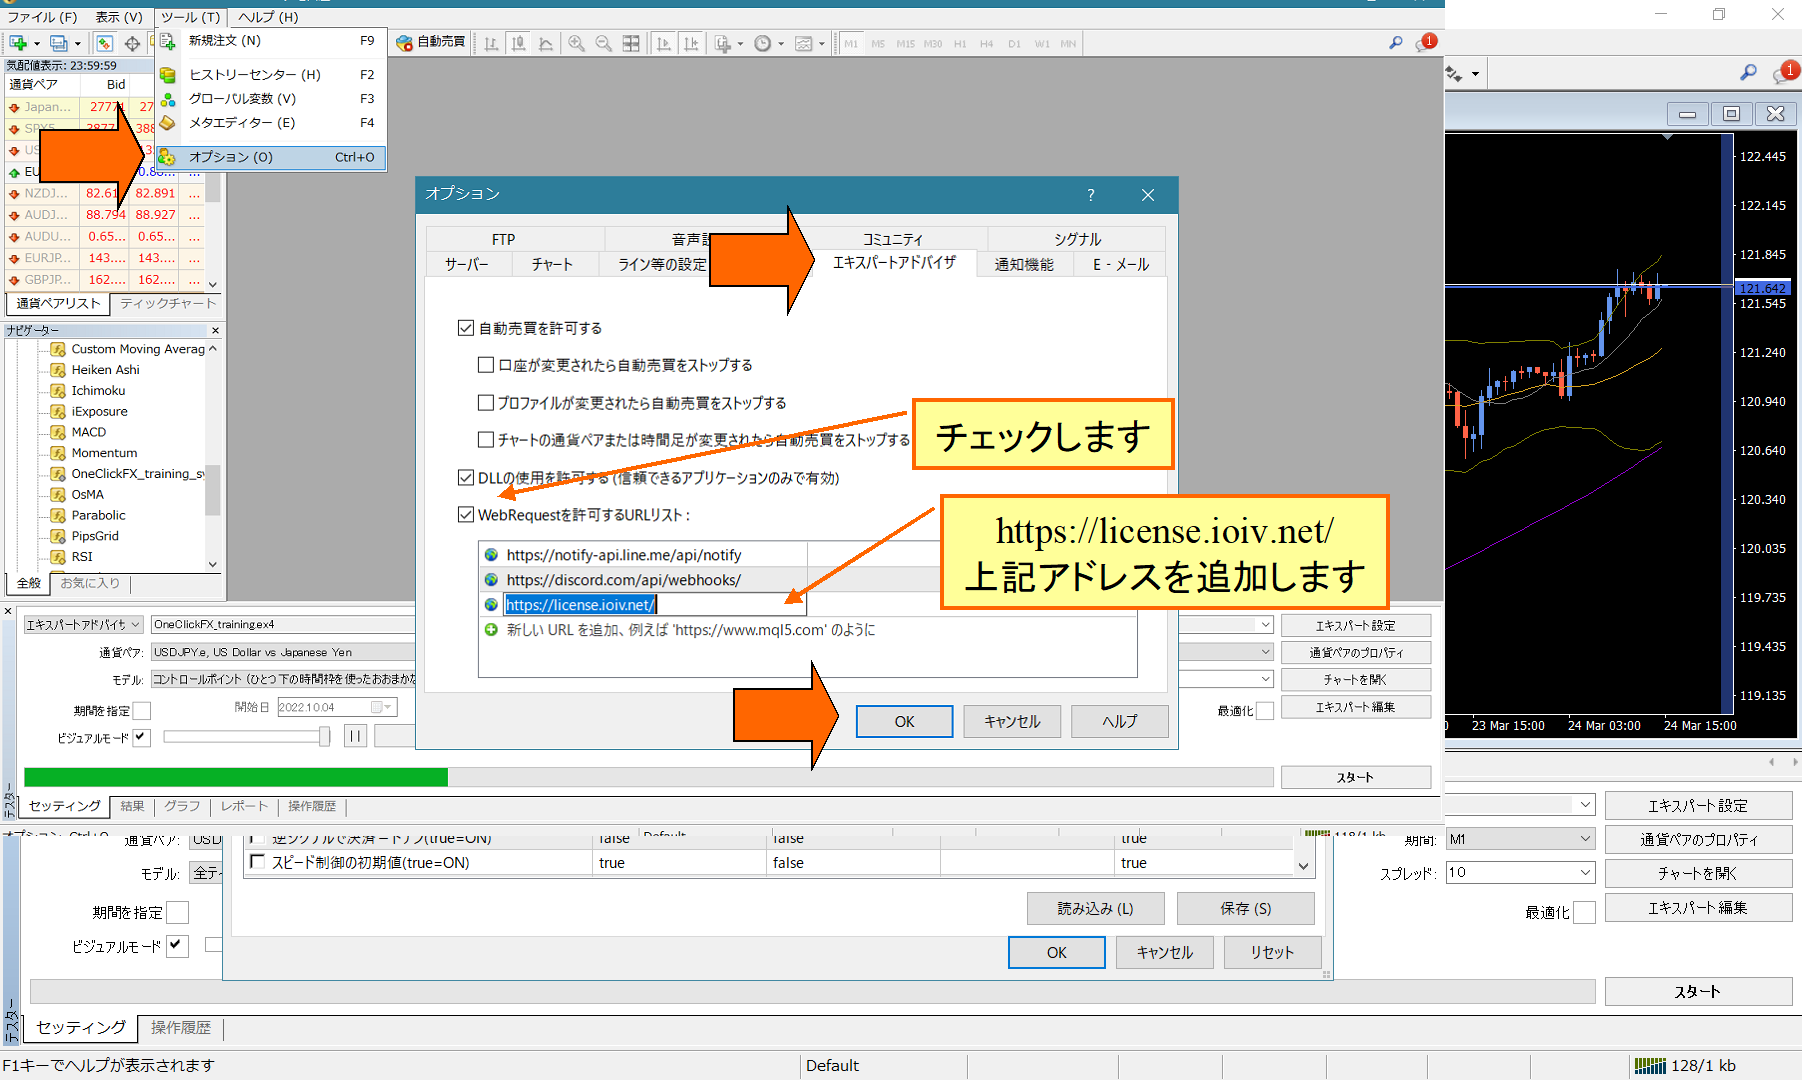
Copying Product Files
1) In MT4, choose Data Folder from the File menu.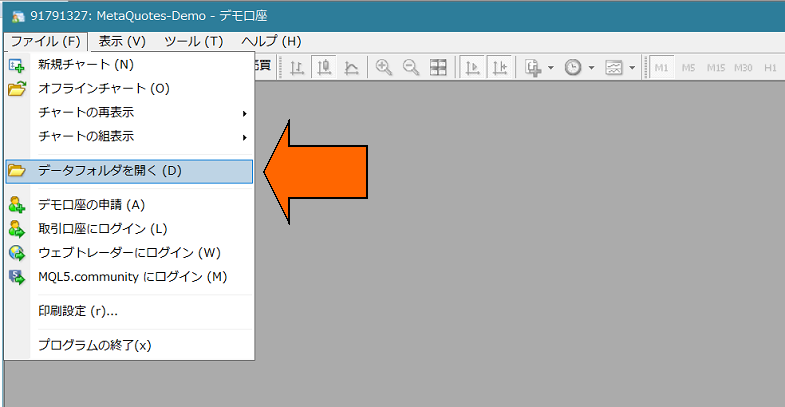
2) Overwrite copy all MQL4, templates, and tester folders from this product into the data folder.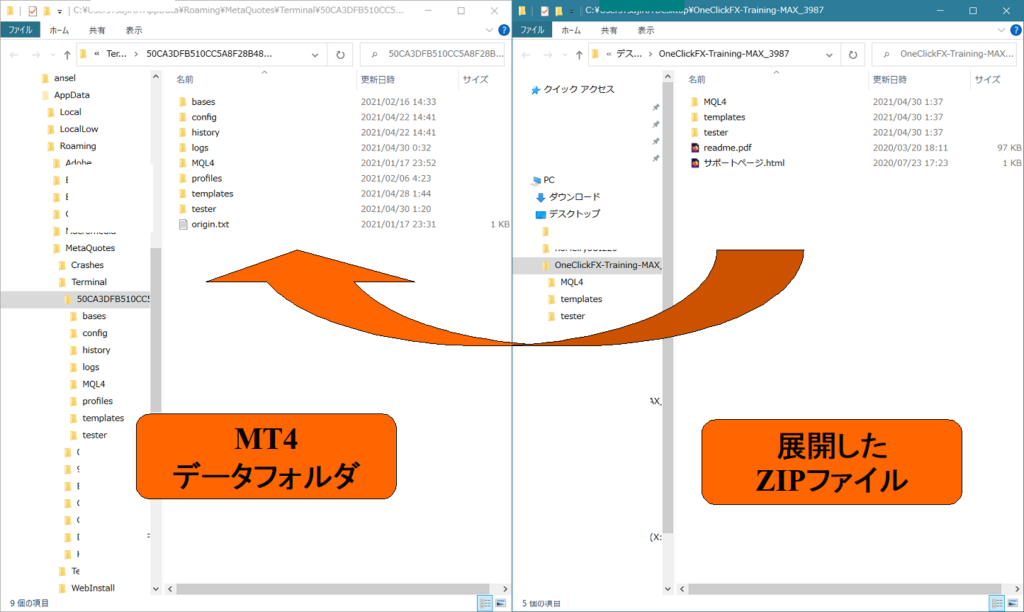
3) Restart MT4.
Launching One-Click FX Training
4) Open the Strategy Tester window.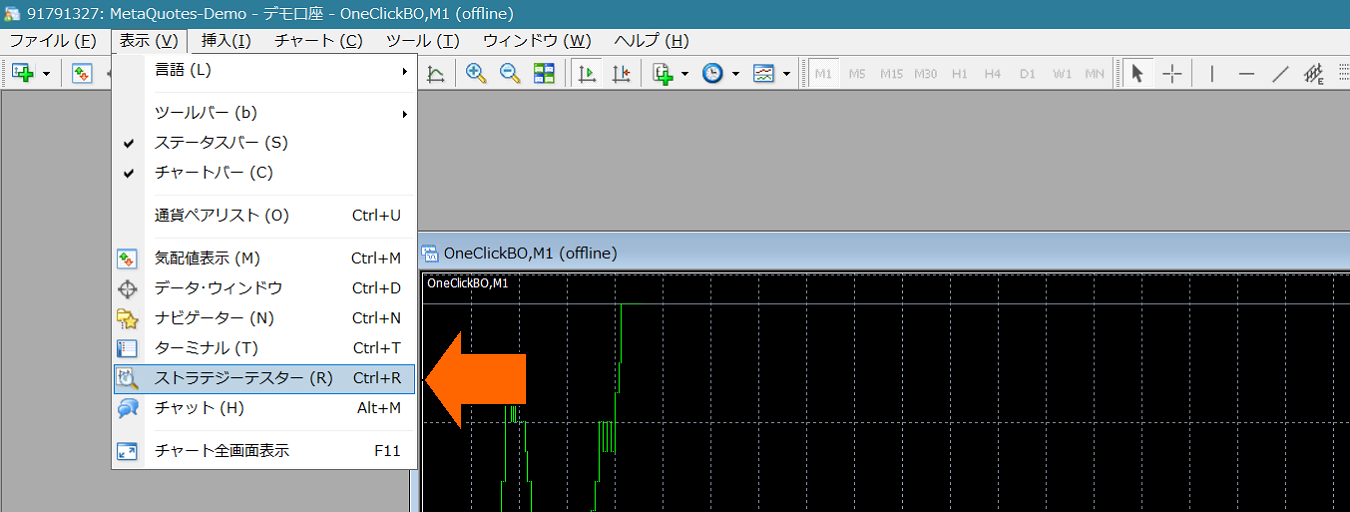
5) In the Strategy Tester, select Expert “OneClickFX_training”, any currency pair,Model is “Control Point”. Check Visual Mode, uncheck Optimization. Increase the Speed slider to 31 or 32.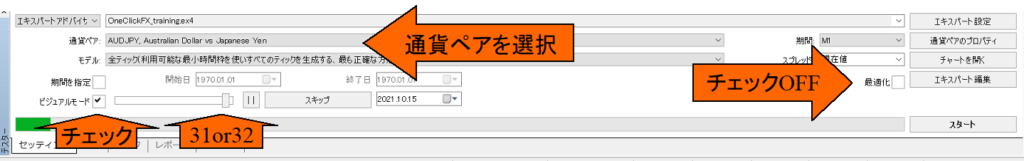
6) [Important]After entering the Parameter “GoGoJungle Nickname or Member ID”, press OK (Other parameter information will be described later)Unregistered accounts cannot be used.>

7) Press the Start button in the Tester window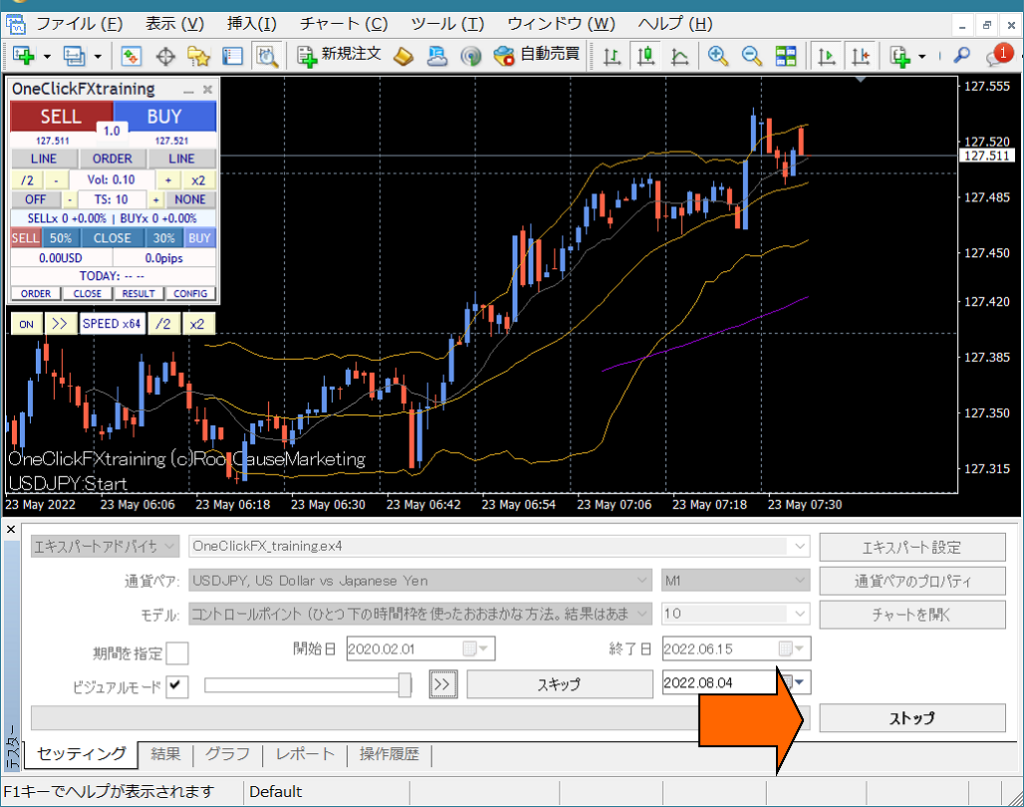
This will run with default values. Press the Buy/Sell and Settlement buttons to verify operation.
If it stops immediately after starting, please check the operation history tab for errors.
If you want to practice trading quickly
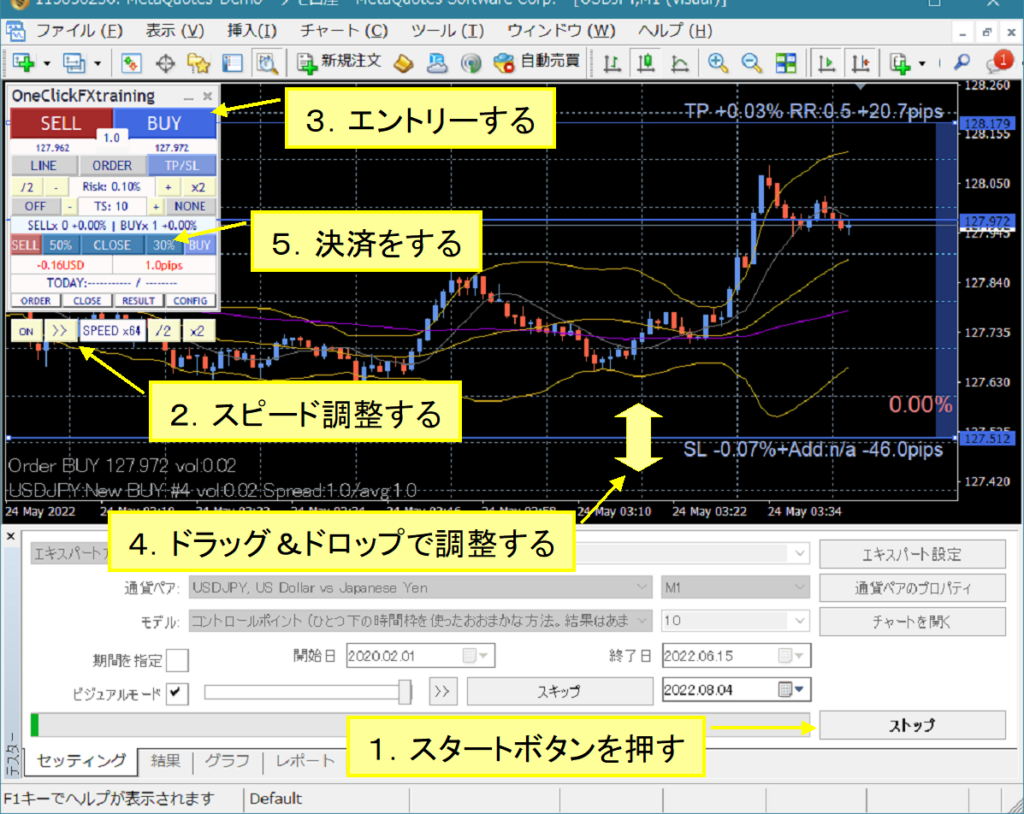
You can change the standard chart even after pressing Start
Set the margin to Japanese Yen
From the Expert button, open the test settings and directly enter “JPY” in the right-hand drop-down for the initial margin. Because this will reduce funds, please add two zeros.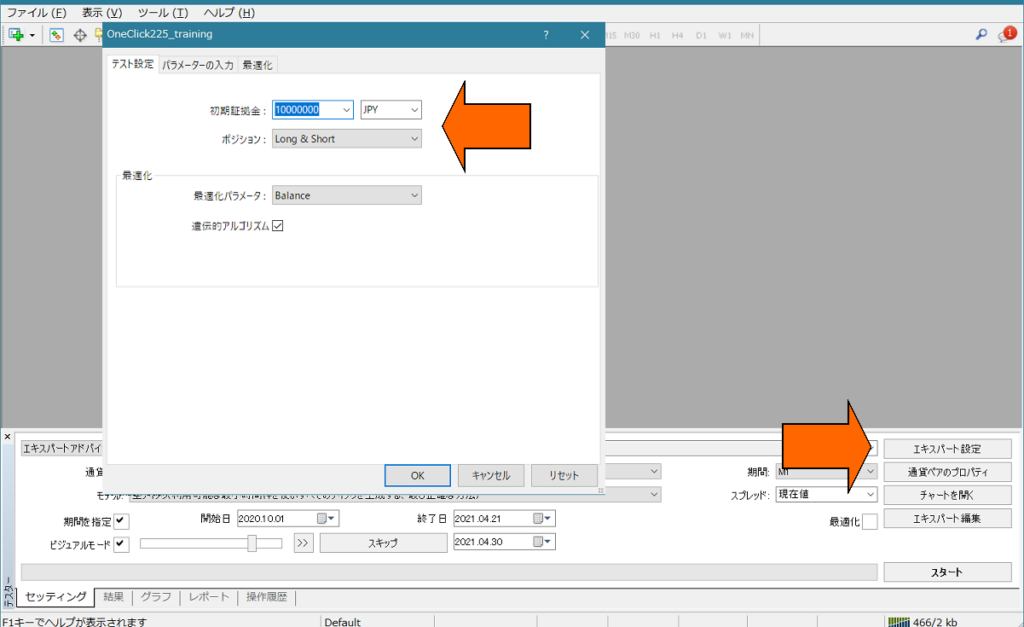
Depending on the broker, orders may be stopped immediately if the currency pair is not in Japanese Yen. In that case, adjust the margin to the pair being used.
Operations & Parameter Settings
How to use One-Click FX Training MAX
Main Panel (Normal Mode)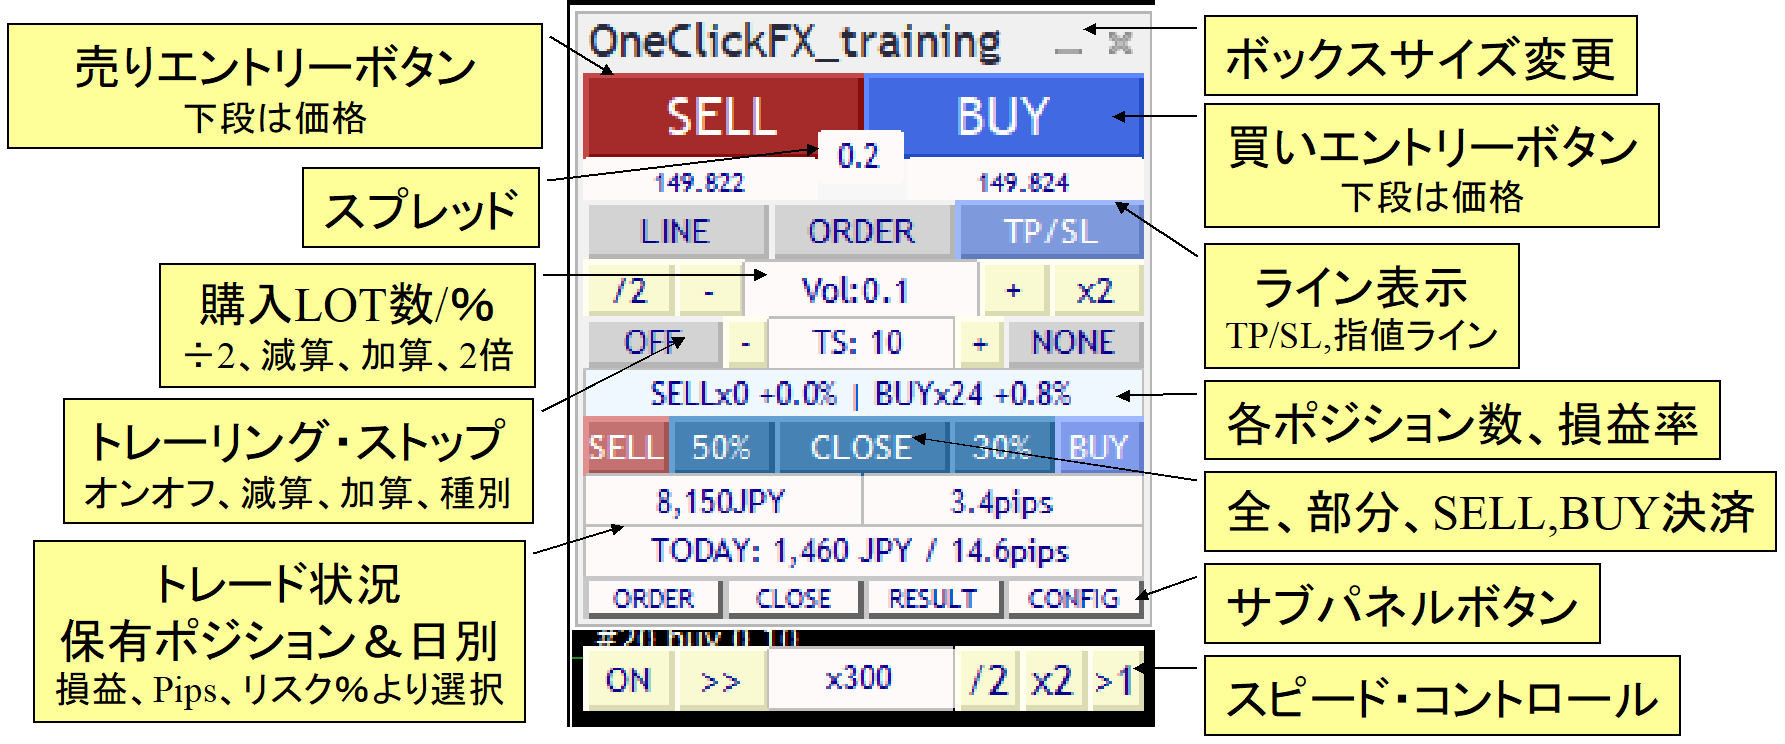
Focus Mode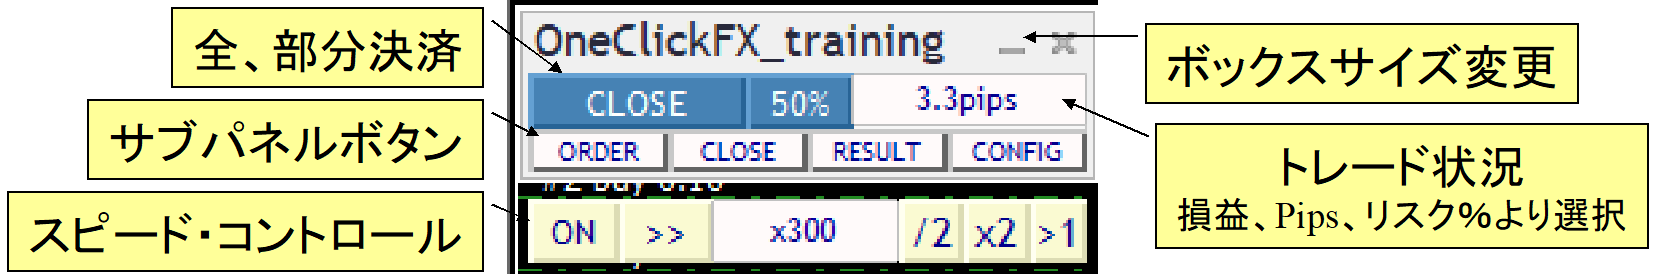
Sub Panel for Orders
Sub Panel for Closes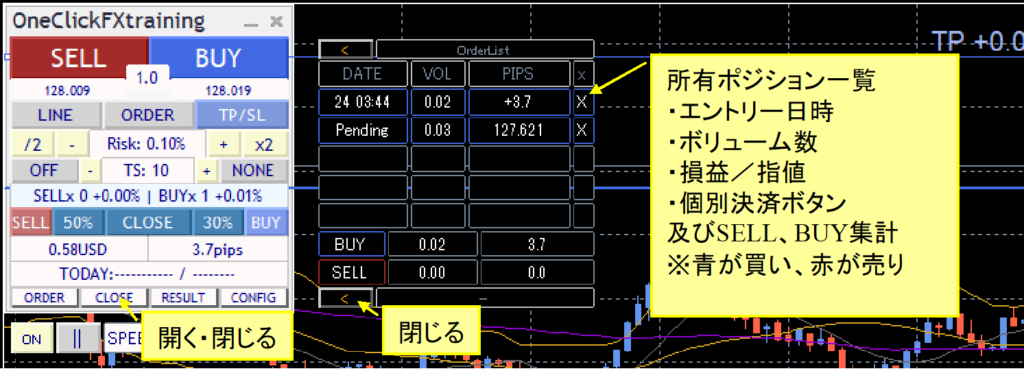
Sub Panel for History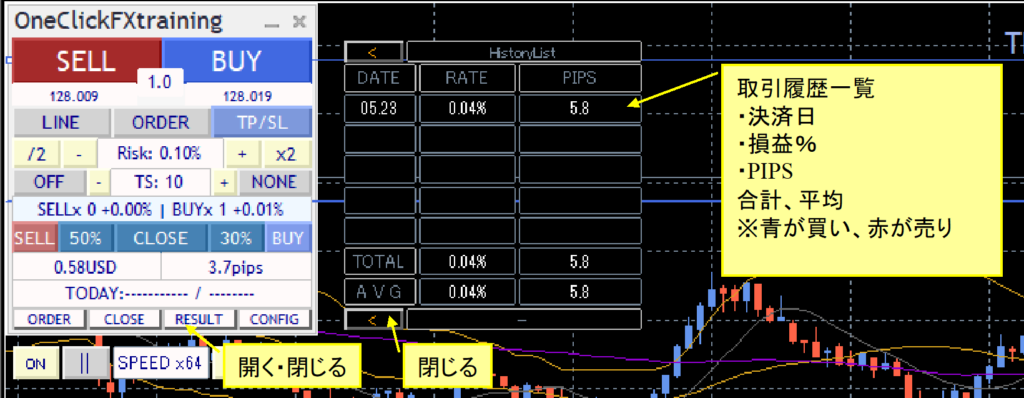
Other Sub Panels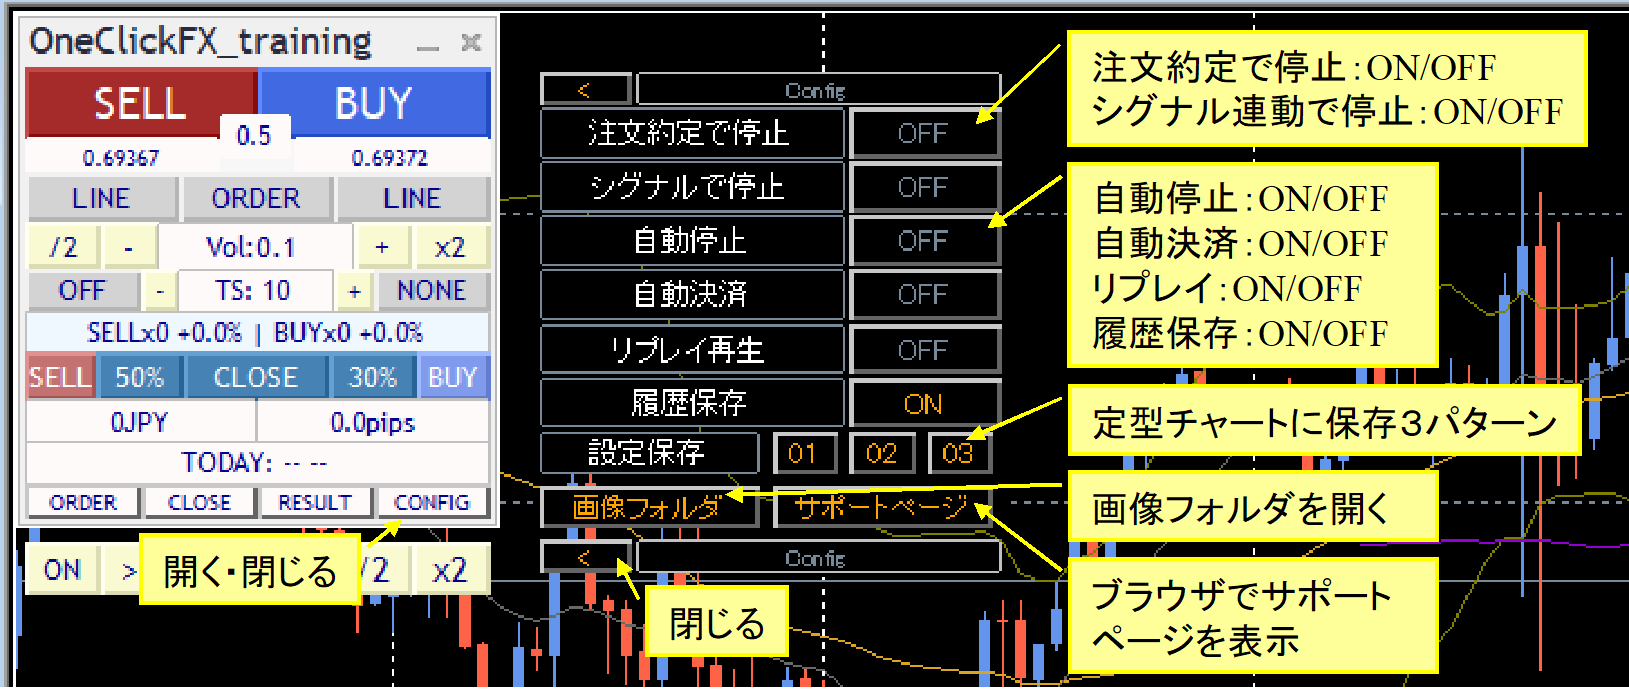
Parameter Settings for OneClickFX_training
| Item | Content |
|---|---|
| Email address at purchase | Please enter your email address |
| Focus Indicator 1, 2, 3 | You can choose from three indicators: profit/loss, PIPS, and risk % for each. Indicator 1: left of the control box, Indicator 2: right of the control box, focus mode, Indicator 3: center-right of the chart (NONE hides it) |
| Initial Lot Size / Risk %, Change Value | Set the initial value and increment for lot size or risk %. |
| Server Orders | Choose whether to place TP/SL on the server, either both or SL only. The first TP/SL and first SL are set only at the first order; after that, changing TP/SL lines does not modify the order contents. |
| Loss Cut Line = SLpips (minimum 1) | Specify the initial PIPS from the Break-Even line to the take-profit (stop) line. |
| Risk-Reward | Specify how many times the difference between the Break-Even line and the SL should be used as the initial TP. If SL is 100 and Risk-Reward is 1.5, the initial TP is 150 pips from the Break-Even line. |
| Trailing Stop | Trailing stop is automatic trailing profit protection by the tool control. |
| Partial Close Rate 1, 2 | Specify the percentages for partial closes next to the ALL Close button. Default values are 50% and 30%. |
| Maximum Number of Positions | Limit the maximum number of positions you can enter. Some brokers may impose limits beforehand. Zero means unlimited |
| PIPS => Points Conversion Factor | Specify the value used to convert PIPS to points. As long as you are using this in FX, zero is fine. For CFDs, different brokers have different numbers, so adjust the multiplier accordingly |
| Acceptable Slippage | Specify the acceptable slippage in points |
| Use ASK Line | Display triangles aligned to the ASK line. If false, adjust for spread and display with normal lines. Note: large spread fluctuations may cause minor discrepancies |
| Turn TP/SL Lines On at Order/Fill | When you press the order button, TP/SL lines are set to default. If you turn TP/SL off after placing a limit order, they turn ON again when filled. |
| Auto Calculate Lot Size Initial Value | If you want lot calculation to be automatic from risk %, set true |
| Initial Value for Trailing Stop Initial Value for Trailing Stop Type | Set whether the trailing stop is On (true) or Off (false) initially, and its type (STD, SHRINK, MA, BB, SAR) initial value. |
| Initial Value for Trailing Stop On TP | When the price reaches the TP on tool control, trailing stop engages immediately rather than closing. You must pre-select the trailing stop type and number. |
| Initial Value for Buy Signal Enable Initial Value for Sell Signal Enable Initial Value for Close Signal Enable | Set the initial ON/OFF state for signal tool integration (true/false). |
| Close on Inverse Signal | If an inverse signal occurs while you hold a position and signal integration is active, decide whether to close the position. true will close and reverse; false will hedge. |
| N** Pips on SL | When SL is touched, do not close but add more positions (averaging). The SL is adjusted per the SL settings. You can limit the maximum number of positions or disable additional buys via automatic lot calculation. |
| Initial Number for Speed Control | Specify which speed in the speed list to start with. |
| Speed List | Specify speed multipliers as a comma-separated list. 60 means 1 second equals 1 minute, 3600 means 1 second equals 1 hour, etc., with a maximum of 604800x (7 days). |
| Initial Stop on Fill | Pause speed control on fill. Resume with the speed control play or ON/OFF toggle. |
| Initial Pause on Signal | When signals are active, pause speed control without entering orders. You can review the situation and press play or ON/OFF to resume. |
| Forced Settlement Time Initial Value for Forced Settlement | Change as needed. If there is a position, settlement occurs at the specified time and pauses. If the initial value is true, it is ON |
| Auto Stop Time Initial Value for Auto Stop | Change as needed. The chart will automatically stop after the specified time. Works on charts of H1 or shorter. If initial value is true, it is ON |
| Replay Initial Value | ON if the initial value is true |
| History Save Initial Value | ON if the initial value is true |
| ▽ Display Settings | |
| GMT offset of connected server Daylight Saving Time | If MT4 shows as is, please use as is. To set to Japan Time, adjust the offset to 2 and enable DST (depends on the connected server, please confirm) |
| Show Final Time | Display the final tick time in the control box. If you adjust for server time difference, the adjusted time is shown. |
| Trade Image Saving Image Size (W x H) | When a trade is executed, and at daily summaries, decide whether to save images. Choose Do Not Save, Full Screen, or target chart. After tester finishes (stop button pressed), the image folder will open. Images are overwritten each time, so copy to another location if needed. |
| Buy Signal Object Name Sell Signal Object Name | Enter the object names used by the signal tool. If partial match, it's treated as the target signal. Default values: ArwUP, ArwDN areOne-Click Auto Arw Tradeand includedSignal Arrowization Toolas default arrow values.You can specify multiple strings separated by commas. All conditions must be AND. |
| Signal Time Target | Enter whether the signal targets the latest bar (0) or past bars (1–). If painting on the latest bar, include the previous bar’s confirmation (1). |
| All Close Signal Objects Buy Close Signal Object Sell Close Signal Object | Enter the object names displayed by the signal tool. If partial match, it is the target signal. Default: ArwCL, ArwCUP, ArwCDN areOne-Click Auto Arw Tradeand includedSignal Arrowization Toolfor matching arrow names. |
| Close Signal Time Target | Enter whether the signal targets the latest bar (0) or past bars (1–). If painting on the latest bar, include the previous bar’s confirmation (1). |
| Signal Indicator NameSignal Indicator Name | Indicator Name (file name) of the target signal toolIndicator Name (file name) of the target signal tool |
| Buy Signal Index Sell Signal Index | |
| Signal Time TargetSignal Time Target | Enter whether the signal targets the latest bar (0) or past bars (1–). If painting on the latest bar, include the previous bar’s confirmation (1).Enter whether the signal targets the latest bar (0) or past bars (1–). If painting on the latest bar, include the previous bar’s confirmation (1). |
| Indicator Parameters 1–8 | Enter the indicator parameters in the correct order by type (integer, decimal, string). After END, default values are used. If you put numbers in string parameters, prefix with a single quote. |
| ▽ Notifications | |
| Notification Settings【Common】 | |
| Depends on screen size; if it doesn’t fit, reduce the corresponding values. | |
| BUY Color SELL Color Trailing Stop Color | Specify colors for the buttons, TP, SL, and trailing lines. Position lines and limit lines will use similar colors by default. If you want the same colors as older versions like V6, change BUY color to Green. |
| Control Box Color Specification | freely set colors for the control box buttons, labels, and text. |
Automatic Calculation by Risk %
Order quantities are automatically calculated from the margin of the position and the risk % (risk %).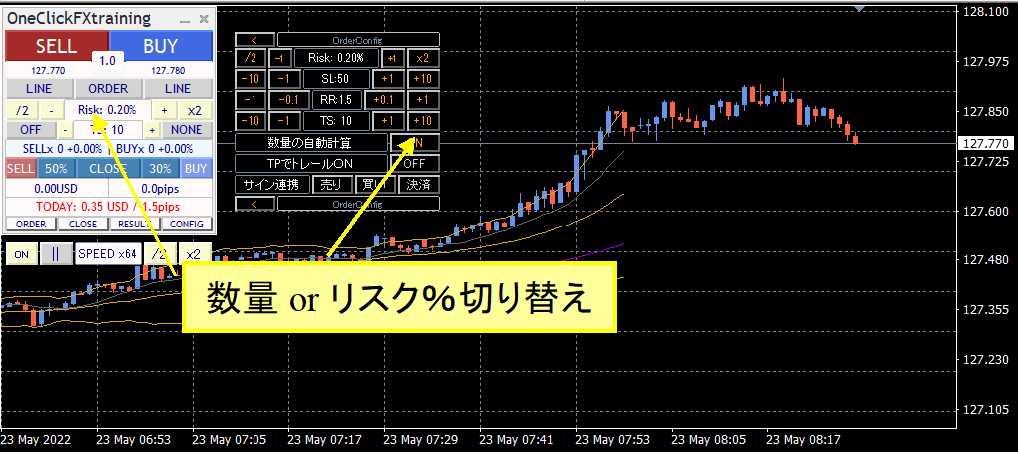
You can toggle this in the control box quantity field or in the Sub Panel under “Auto Calculation of Quantity.”
If TP/SL lines are not shown and a market order is entered, quantities are calculated from the initial SL value and the specified risk %. If TP/SL lines are shown, calculations use the order price and the current price for TP/SL lines.
For limit orders, if TP/SL lines are not shown, quantities are calculated from the order price and the initial SL, and if TP/SL lines are shown, from the order price and the line price.
Note: Turning TP/SL lines on/off resets to the initial value, and automatically calculated order quantities may no longer match the SL line.
TP/SL Lines
Display TP/SL lines with the LINE button on the Control Box.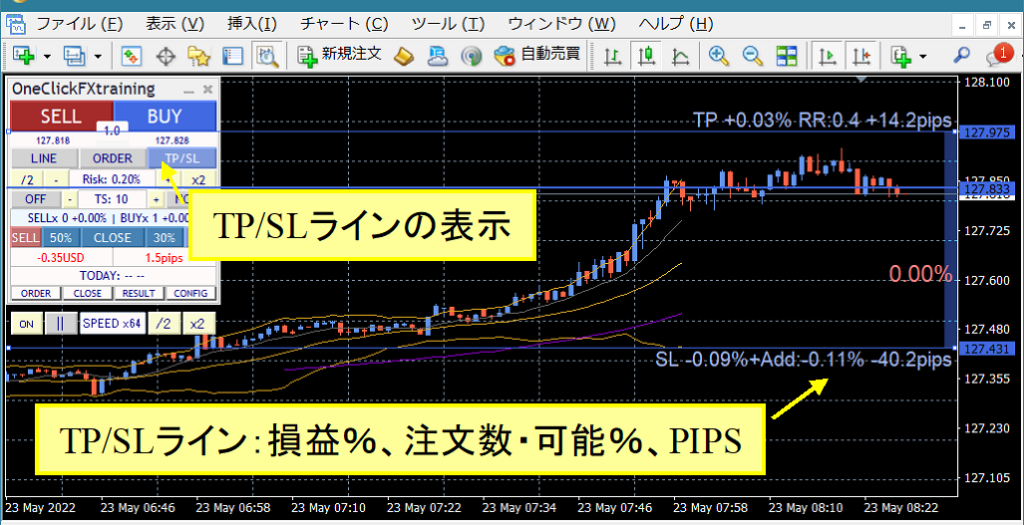
If you hold a position, you’ll see profit/loss at settlement, order quantity or risk % available and PIPS from Break-Even. If you have no position, you’ll see order availability % and PIPS from the current price.
Turning the LINE button ON draws TP/SL lines at the initial values. Turning LINE off/on returns to initial values.
If TP/SL lines are OFF, no settlements occur.
Limit Orders
Use the ORDER button on the Control Box to display limit order lines.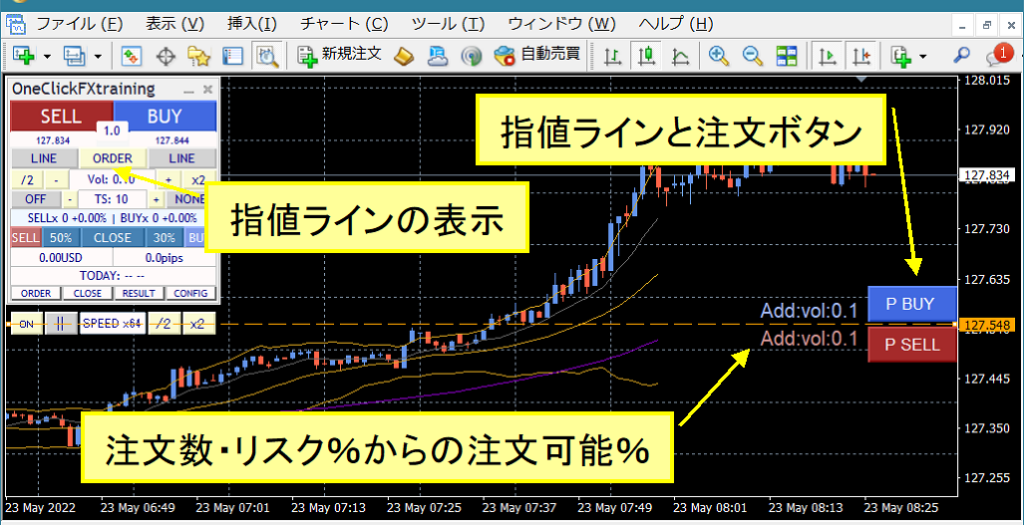
The order button will show when TP/SL lines are displayed for SELL or BUY. If BUY TP/SL lines are not displayed, the P BUY button is not shown. The order quantity or orderable % from risk % is displayed beside the button. If it shows n/a, additional orders are not possible.
Speed Control
The speed control at the bottom of the control box can be increased or decreased using values from the “Speed Control Speed List” parameter. Default values are “1,5,15,30,60,300,900,3600,14400,86400,604800,” ranging from 1x (1 second = 1 second) to 604800x (7 days).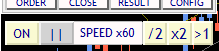
However, it will not exceed the maximum speed of the Strategy Tester. If OFF, speed is the speed set in the Strategy Tester (maximum playback speed).
Also, depending on PC performance and indicators or signal integration, performance may slow down.
For comfortable use, move MT4 speed gauge to the far right (fastest) before using speed control.
Trailing Stop
This feature supports settlements at multiple timing points.
Change with the method button, and enable/disable after deciding on a method. When OFF, a faint line is shown; turning ON puts it into practical use.
Note: Depending on settings, you may be settled the moment you turn ON, or you may be settled immediately after entering a BUY when the MA line is above the current price. Please be cautious of such cases.
- Standard (STD)
Settlements occur when the price moves a specified amount below the highest/lowest price after placing the order. Default is 100 points.
- Shrink (SHRINK)
Similar to Standard, but if the highest/lowest value is not updated and moves to the next candle, the settlement line moves closer by 5% per bar until updated. Values safeguard profits when price moves stop. Default starts from 100 points and moves closer by 5% when a bar that does not update the high/low appears.
- Moving Average (MA)
Settle when touching the moving average line of the specified period. Settlement occurs when a trend changes. The T/S value becomes the moving average period (e.g., MA20).
- Bollinger Bands (BB)
Settle when touching the upper or lower Bollinger Band for the specified period. For a long, touch the lower band; for a short, touch the upper band. Like MA, T/S value is the period (MA20, etc.). Deviation 2 is fixed and cannot be changed.
- Stop-and-Reverse (SAR)
Settle when touching the Parabolic SAR with the specified step. SAR by J. W. Welles Wilder is an indicator signaling market reversals. T/S value is in 1/1000 increments. Default 10 means 0.01. If 1, it is 0.001. Use with standard Parabolic SAR values to guide usage.
Replay
Here are steps to ensure Replay works correctly.
To save trade history, perform practice trades and, before pressing the Stop button to finish, turn on History Save in the sub panel.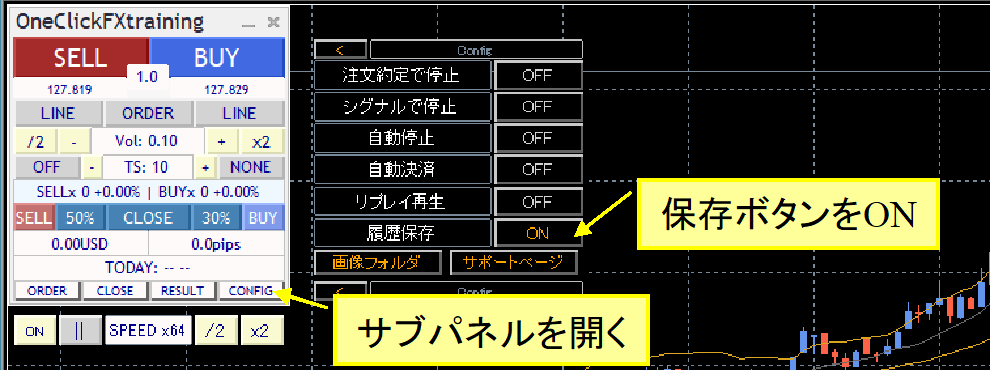
Open charts at the same time and play, but turn on Replay in the sub panel.
During replay, you can turn replay off and on again from the middle. You can also manually settle trades opened during replay. You can participate during replay as well.
If you start replay immediately after starting, set the parameter “Replay Playback Initial Value” to true.
Only one history can be saved, so if you finish with History Save ON, it will be overwritten.
Since you must trade in the same period, you cannot replay trades from a different time. Example: you cannot replay 2018 trades saved in 2019.
If tick data is regenerated, data integrity may break, making replay unreliable. This replay does not guarantee complete accuracy.
Auto Image Saving
If you set trade image saving to true, screenshots are automatically taken at order and settlement times.
Additionally, at the moment the date changes, the previous day’s trades are saved as a single image.
At tester end (when you press Stop), the save folder opens.
Save destination: Data folder → tester/files/OshiraseSnap.
Also, please copy all tester folders included in the product files.
Saved image files will be overwritten each time you start the tester, so copy to another location if you want to keep them.
Daily Summary Result Display
Open the sub panel to see yellow lines on past trades and the PIPS result count.
Also, clicking the date or TOTAL in the RESULT sub panel displays the summary results.
Even in the middle of a day, you can view the status up to that point.
Subchart Synchronization Settings
There are two types of synchronization subcharts.
1. Simple synchronization using ordinary online charts, lightweight and easy switching
2. Active synchronization using active offline charts that closely resemble real-time display
Simple synchronization uses ordinary online charts, so if past data is prepared, specifying a standard chart starts synchronization easily and you can create synchronized charts quickly. Timeframe switches and currency pair changes work just like online charts.
However, for indicators that shift (shift), the chart head may not be visible, and some indicators in sub-windows may be unusable due to bugs. There are workarounds but with certain limitations.
Active synchronization creates dedicated offline charts that are updated as needed and displayed like online charts, but since they are offline, some indicators are not supported. Updates are frequent and can slow performance.
Each has pros and cons, so use the chart you find easiest.
Simple Synchronization
1) Open the chart for any currency pair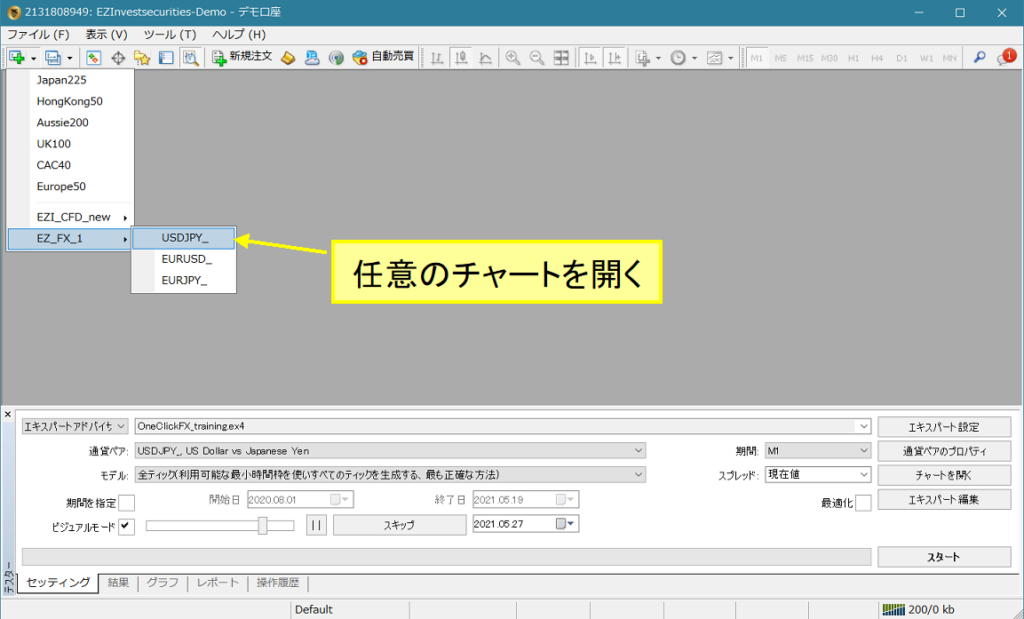
2) Right-click → Standard Chart → OneClickFX_training_sync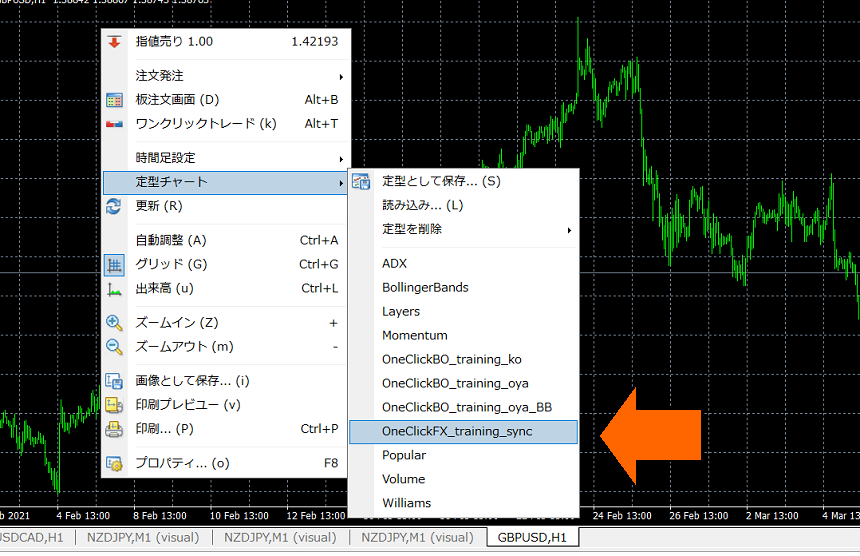
3) If needed, change parameters and press OK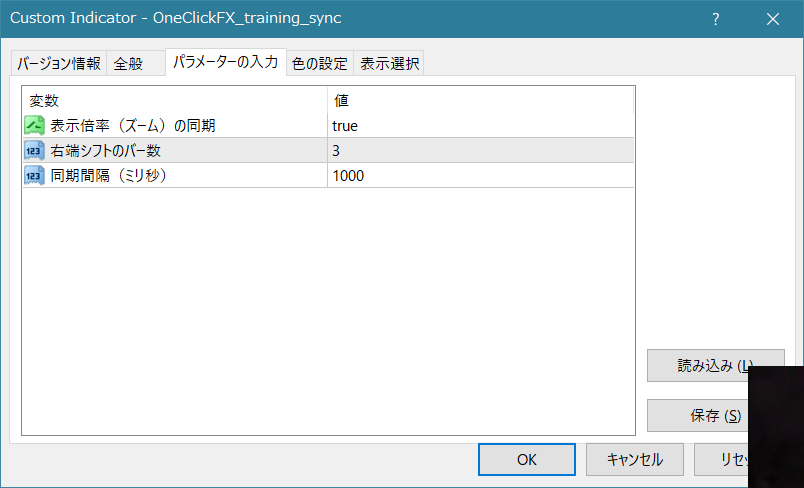
4) The charts will synchronize
Note: If speed is too fast, synchronization may lag
Active Synchronization
There are two ways to create all timeframes for a currency pair: all at once or individually.
1) Open the chart of the currency pair to synchronize
Create individual offline charts for synchronization
2) Display the timeframe to synchronize
3) Right-click → Standard Chart → select “OneClickFX_training_sync.” It will show “Active offline sync ready.”
Proceed to step 4.
Create offline charts for synchronization in one go
2) Right-click → Standard Chart → select “Create Offline Chart”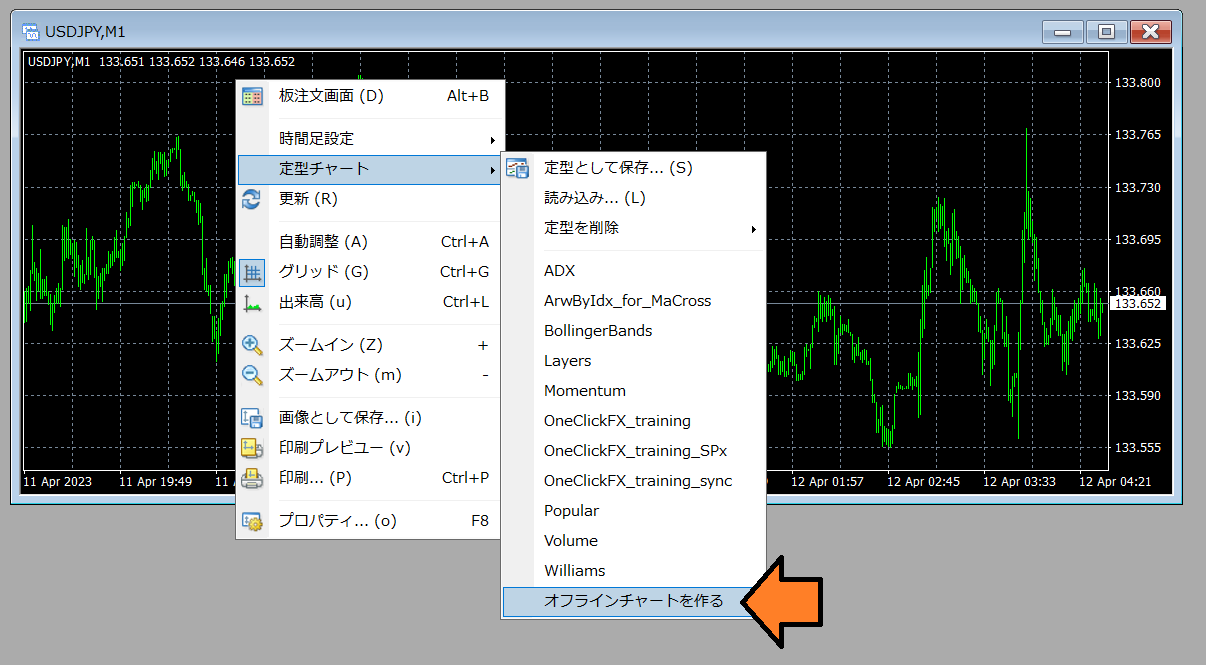
3) Data loading will start automatically; wait until it finishes and close the chart.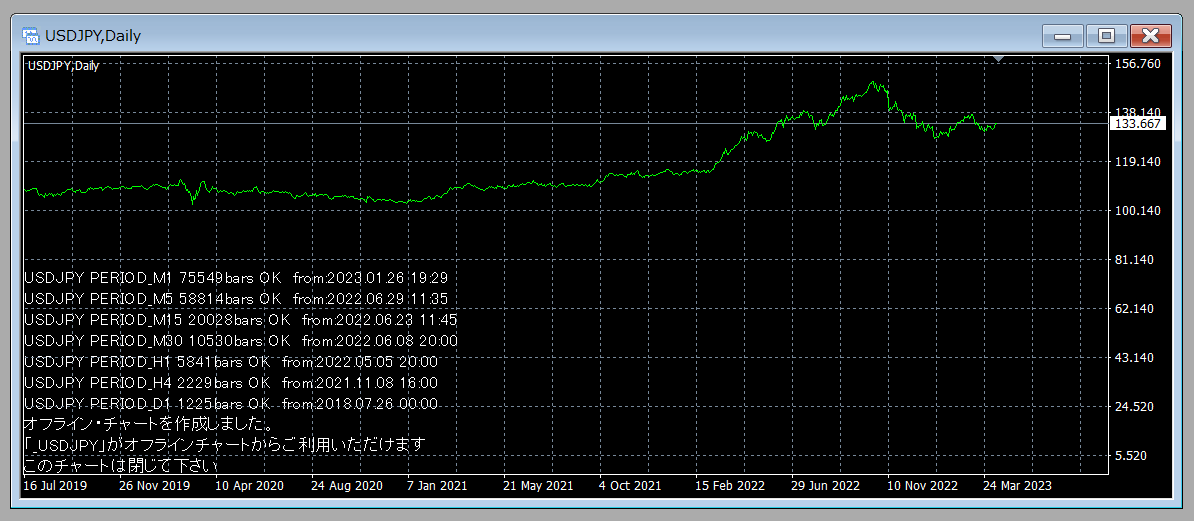
Proceed to step 4.
Open Offline Charts for Active Synchronization
4) In the menu, File → Offline Charts, open an offline chart whose name starts with “_” (underscore). (Images start from “_USDJPY” for 1-minute to daily.)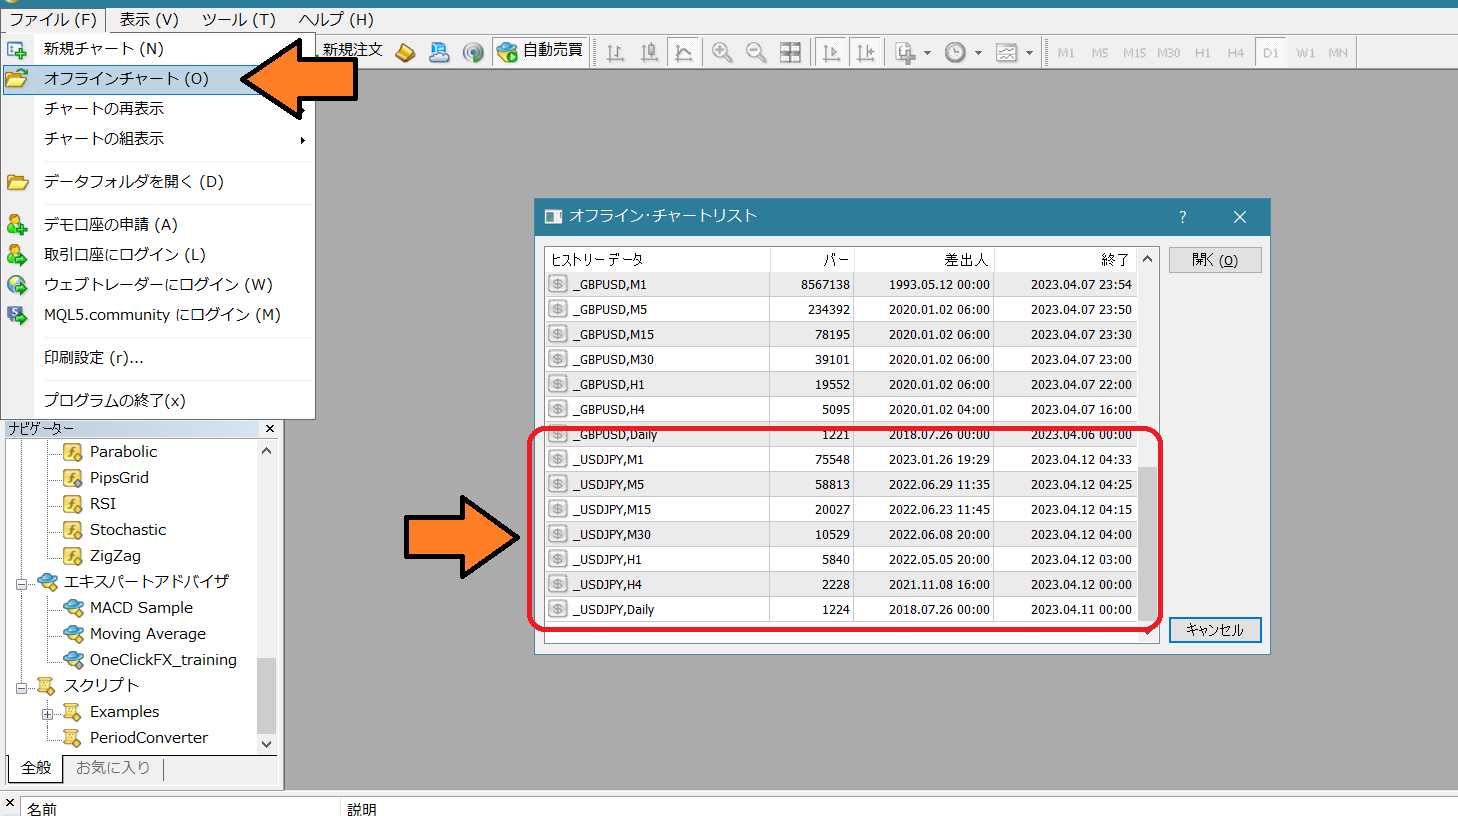
5) Right-click → Standard Chart → OneClickFX_training_sync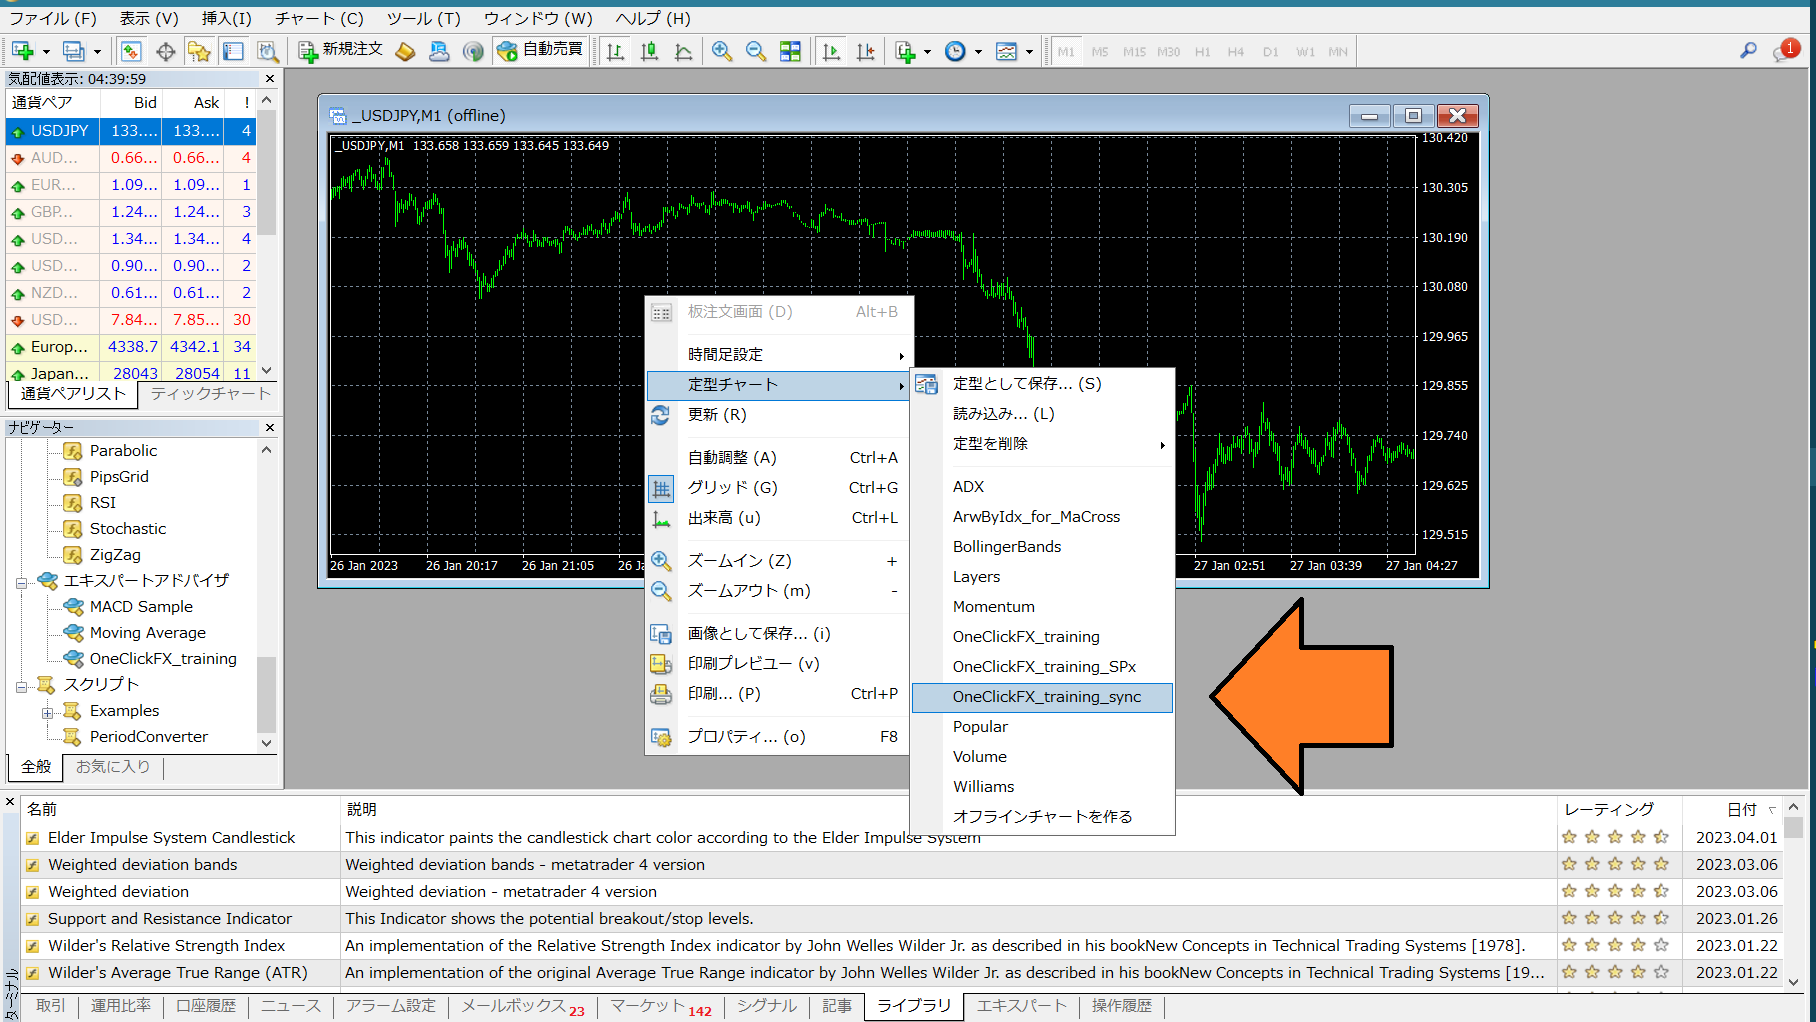
3) As in Simple Synchronization, adjust parameters as needed and press OK. The charts will synchronize.
Integration with Signal Tools
OneClick Auto Arw Trade【AutoArwTrade】for easy integration and the includedSignal Arrowization Tool(free version) lets you enter entries in response to arrows from other signal tools and enter on chart changes like Golden Cross.
Integration with OneClick Auto Arw Trade
1. Add a compatible signal tool to the chart.
2. Turn on Buy/Sell signals button in signal integration.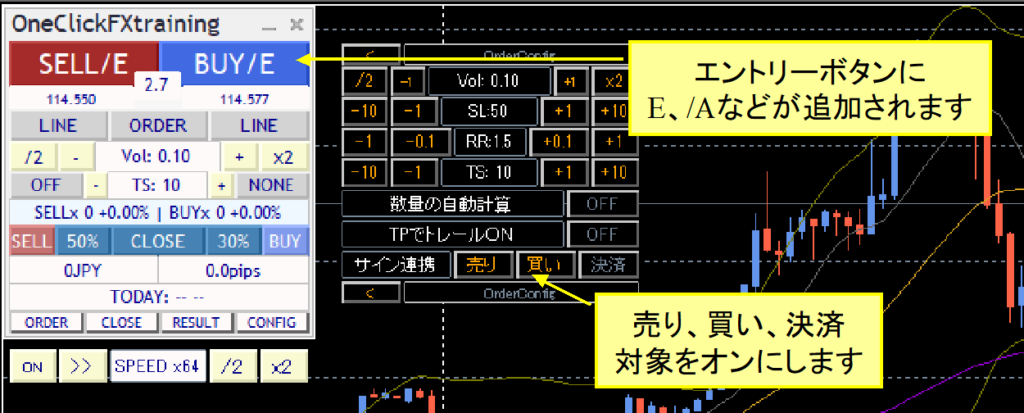
Signal integration has two modes: if a signal activates a temporary pause by parameter, or if CONFIG signal is ON, it will pause without entering and you can analyze with speed control. If OFF, it will not pause and will enter. If Pause is ON, it will stop upon signal generation, enabling analysis for discretionary trading at signal times.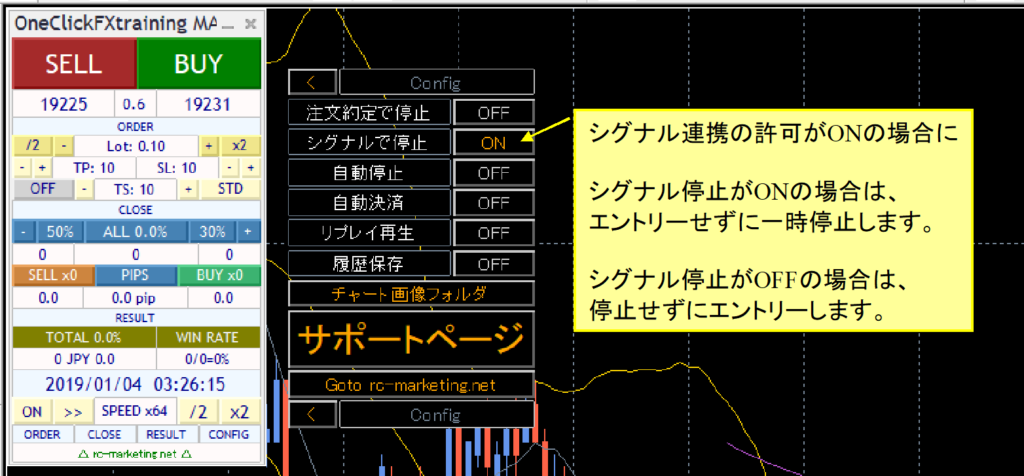
If you turn off the leftmost Speed Control button, speed becomes fastest (max bar). If arrows do not appear, try fast-forwarding to where they would appear.
Integration with Signaling Arrowization Tool
The following sample standard charts are included for you to try
ArwByIdx_for_MaCross.tpl ... Moving Average cross
When you start the tester, right-click → Standard Chart and select the above standard chart.
In the Orders sub-panel, enable Signal Integration (Sell, Buy, Close); the buttons gain /E (or /A).
Signal Integration with Complex Conditions
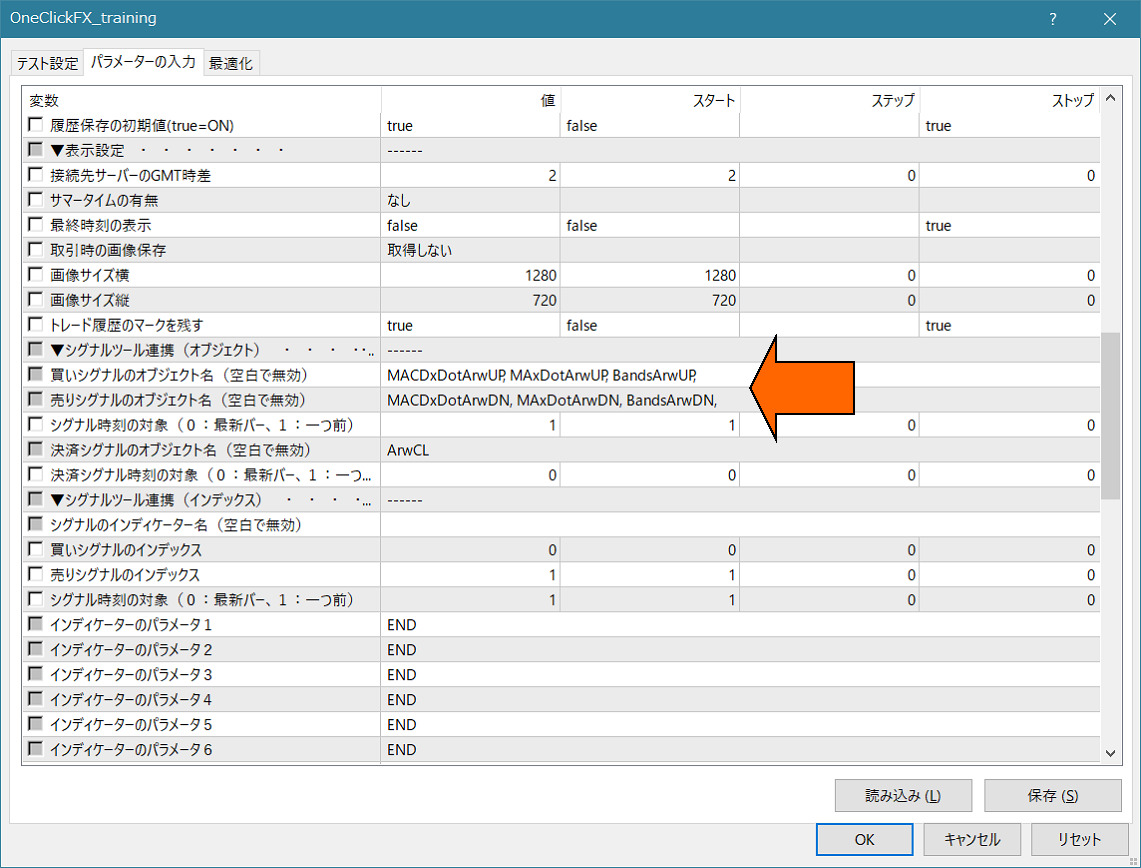
Change the signal integration parameters for the above in the same way as simple integration.
Sell Signal Object Names: MACDxDotArwUP, MAxDotArwUP, BandsArwUP,
Buy Signal Object Names: MACDxDotArwDN, MAxDotArwDN, BandsArwDN,
Press the bottom-right Load button in the parameter settings screen to apply the preset “OneClickFX_training_SPx.set” for the above settings.
Apply the above settings and operate as with simple integration.
Arrows or dots appear at the limits; when all three conditions match, signal integration is activated.
If you change the parameters of “ArwByIdx” and register them in the standard chart, you can freely change the standard chart even while the tester is running.
Feel free to experiment with combinations.
If you don’t know how to set it up, please contact us. Your existing signal tools can be integrated with minimal effort.
If you tell us the signal tool name and parameter information, we can share the configuration details.
Included Indicators
・Can adjust grid display in Pips units
PipsGrid Support Page
・Signal Arrowization Tool“ArwByIdx_rcm” (cheap version)
Signal Arrowization Tool Support Page
Notes
This is a diverse market, and we cannot guarantee compatibility with all signal tools. In particular, products that are password-protected or have measures against integration cannot be integrated. There may be paid options to customize integration. Please contact us. This product is a training tool; its results do not guarantee actual results. Prices shown by brokers may not match the prices displayed by this tool. For security, online authentication uses encrypted SSL communications.
When in doubt
If it is not functioning properly, behaving oddly, or stopping suddenly, first consult this location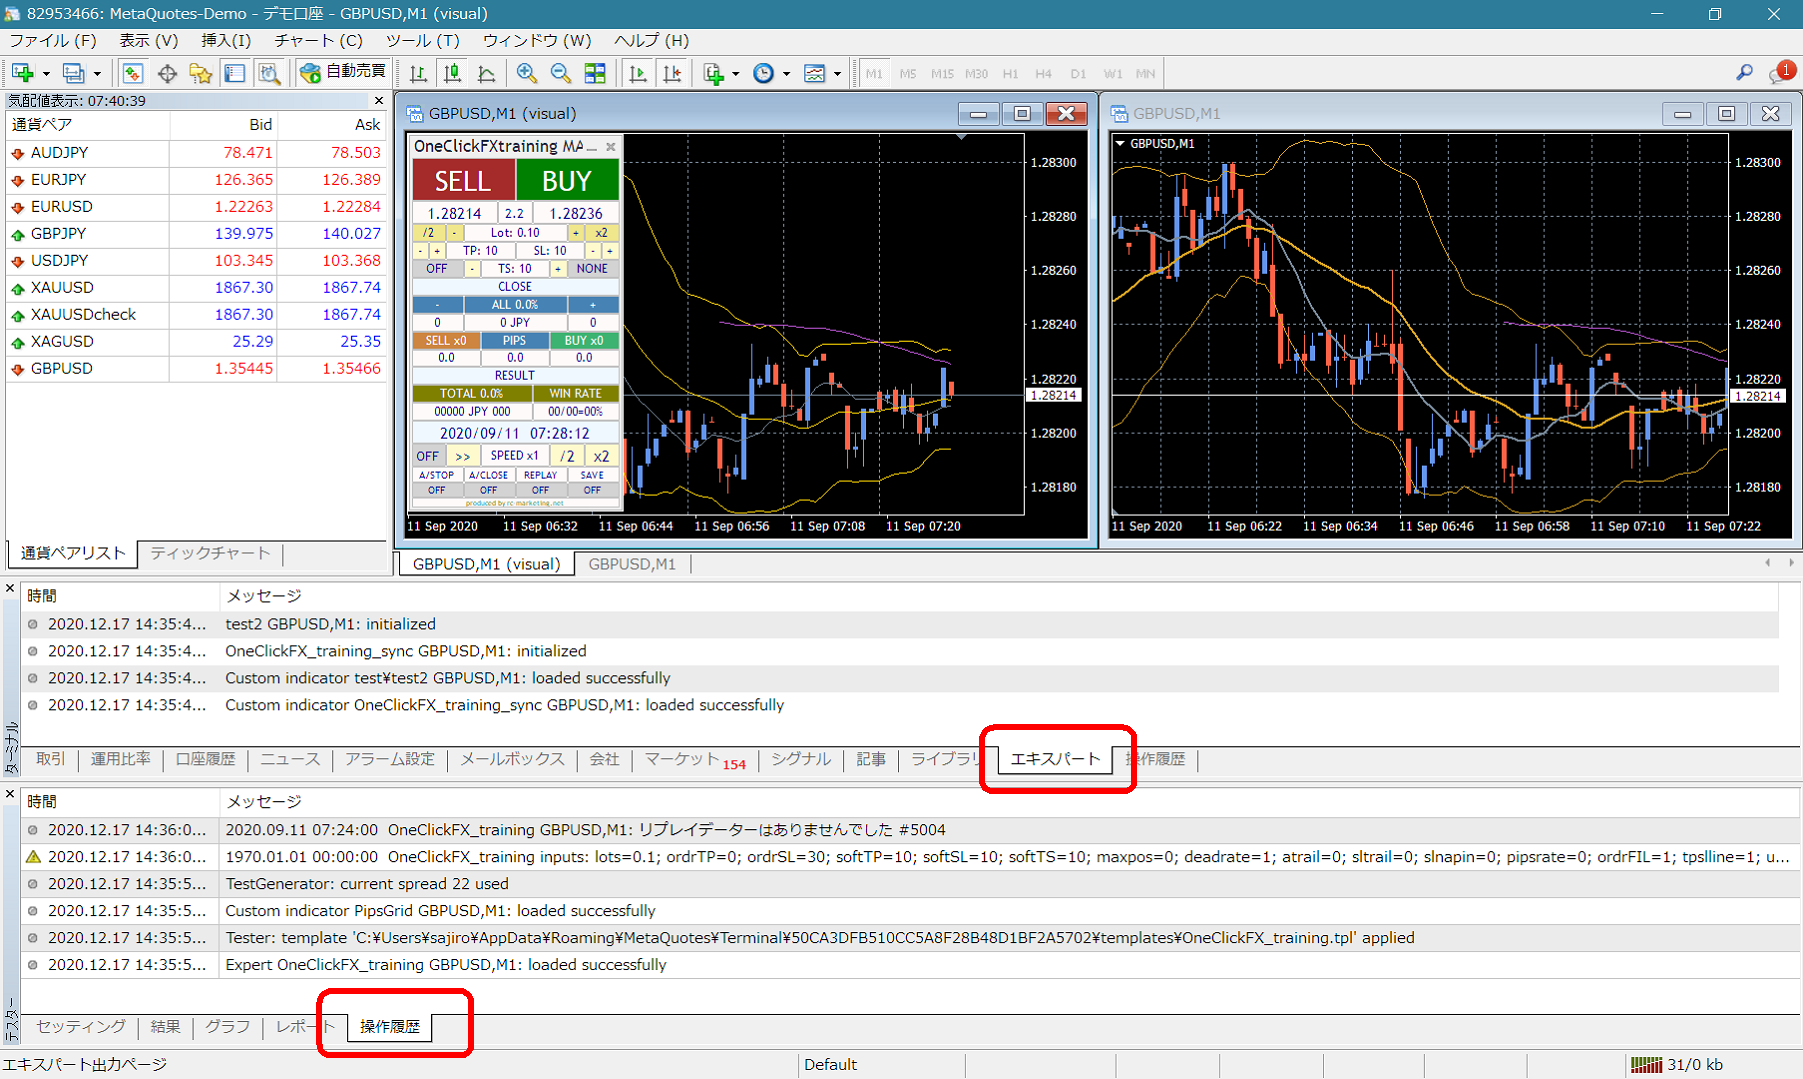 If there are error messages in the terminal expert or tester operation history, please inform us so we can respond smoothly. Thank you for your cooperation.
Cautions
When using this tool, please understand its performance and use it at your own risk.