

【BTCJPY】20181010 Daily Pivot
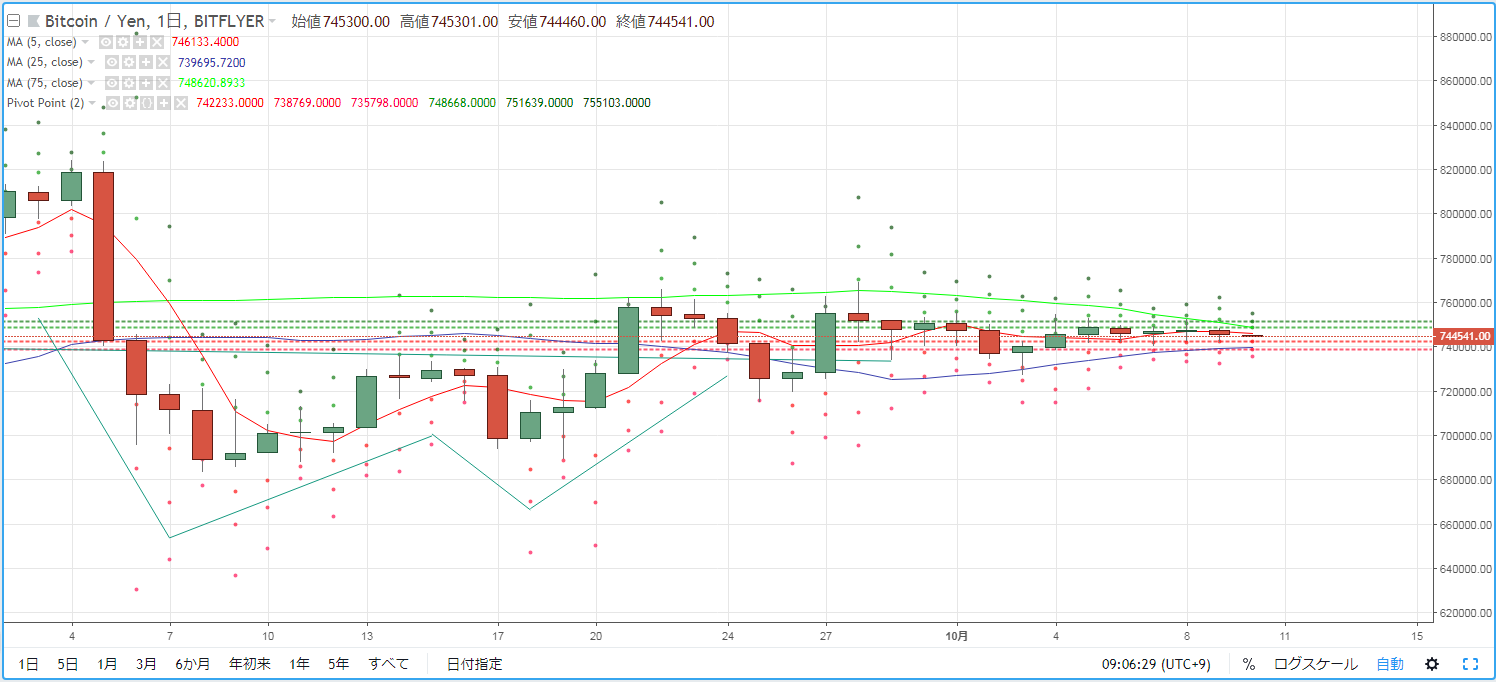
As a guideline for day trading BTCJPY, we check the pivot. Yesterday (October 9) also showed no active price movement, hovering between the 75MA and 25MA. Like the past few days, it was a very quiet market environment.
R2=751,639
R1=748,668
S1=742,233
S2=738,769
※ A pivot is a technical indicator that predicts the day's price movement range based on the previous day's activity. Centered on the Pivot Point (PP), draw resistance lines (R1, R2) above and below, and support lines (S1, S2) below, and use them as trading references.
【Calculation Formula】
Pivot Point (PP) = (Previous Day's Close + Previous Day's High + Previous Day's Open) / 3
Resistance Line 1 (R1) = PP + (PP - Previous Day's Low)
Support Line 1 (S1) = PP - (Previous Day's High - PP)
Resistance Line 2 (R2) = PP + (Previous Day's High - Previous Day's Low)
Support Line 2 (S2) = PP - (Previous Day's High - Previous Day's Low)


