

【BTCJPY】20181009 Daily Pivot
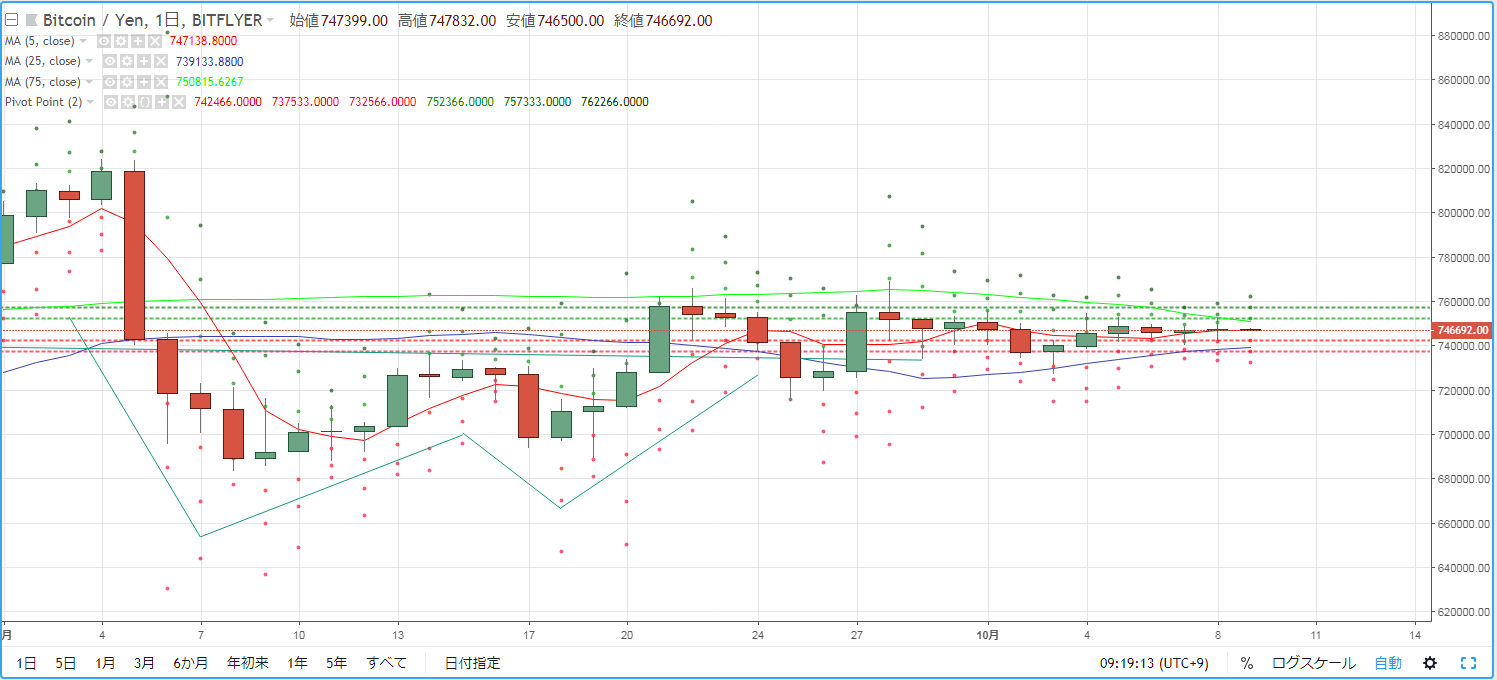
As a guideline for day trading BTCJPY, we confirm the pivot. Yesterday (October 8) the market environment remained largely in a range with a downward-sloping 75MA and an upward-sloping 25MA.
R2=757,333
R1=752,366
S1=742,466
S2=737,533
※ A pivot is a technical indicator that predicts intraday price movement based on the previous day's price action. Centered on the Pivot Point (PP), draw resistance lines (R1, R2) and support lines (S1, S2) above and below, and use them as trading guides.
【Calculations】
Pivot Point (PP) = (Previous day's close + previous day's high + previous day's low) / 3
Resistance Line 1 (R1) = PP + (PP - previous day's low)
Support Line 1 (S1) = PP - (previous day's high - PP)
Resistance Line 2 (R2) = PP + (previous day's high - previous day's low)
Support Line 2 (S2) = PP - (previous day's high - previous day's low)


