
[Good risk-reward advantageous trade] Rebound sell signal of double top and mBDSR (RCI two-filter) in higher and lower timeframes
Indicator that captures "tops and bottoms and reversals" in combination with RCI【mBDSR】
Methods and Case Studies (PDF) ★GogoJungle AWARD2020 Winner★
https://www.gogojungle.co.jp/tools/indicators/11836
【Special Video】 First Session (Includes Viewer Exclusive Indicator)
https://www.gogojungle.co.jp/finance/navi/articles/70917
【Special Video】 Second Session
https://www.gogojungle.co.jp/finance/navi/articles/71083
【Special Video】 Third Session
https://www.gogojungle.co.jp/finance/navi/articles/71151
AUDCAD 1-hour chart
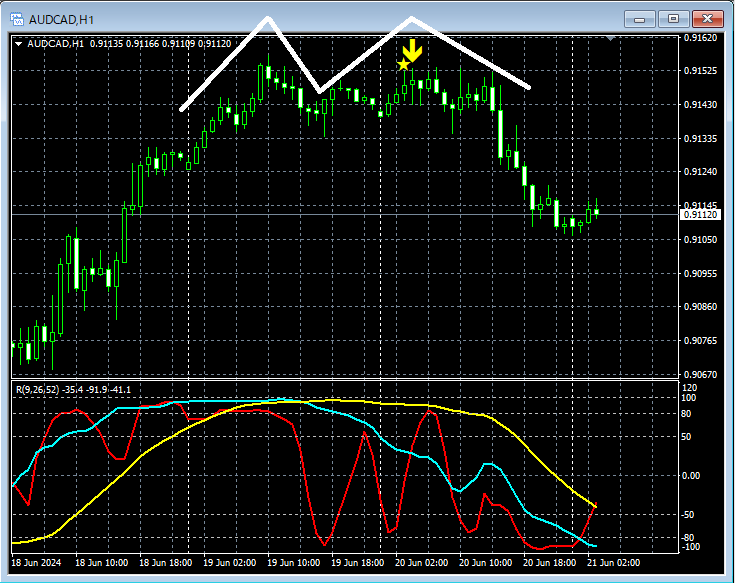
Like the 1-hour chart above,the right peak of the double topandthe mBDSR (filters: RCI26 and RCI52) entering the return selling signallights up,place the stop loss just above the left peak of the double topto achievea trade with a favorable risk-reward ratioand a high edge.
AUDCAD 15-minute chart
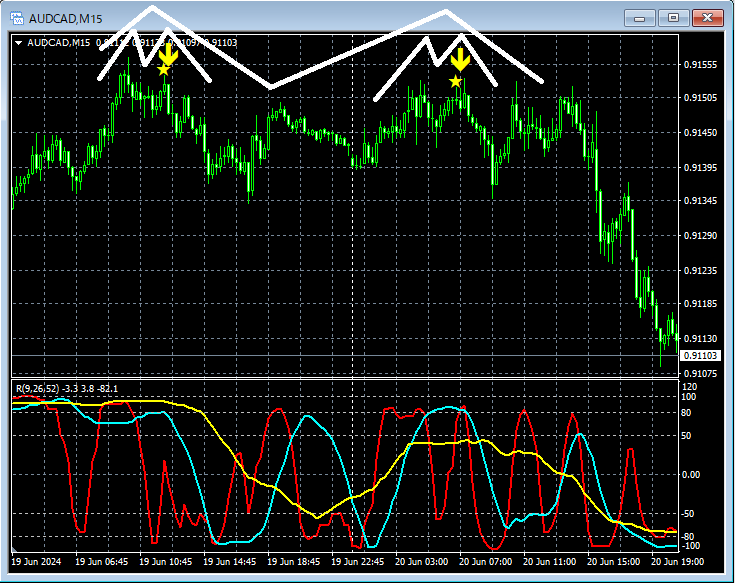
Let’s look more closely at the 15-minute chart. In the previously mentioned 1-hour chartthe left peak of the double topandthe right peak of the double topeach form adouble topand, for each,the right peak of the double topshowsthe mBDSR (filters: RCI26 and RCI52) returning sell signallit up.
From this example,the signal characteristics of mBDSR (filters: RCI26 and RCI52)can be utilized to achievea trade with a favorable risk-reward ratio and a strong edge.
Indicator that shines in combination with RCI【BODSOR・mBDSR】
Methods and Case Studies (PDF) ★GogoJungle AWARD2020 Winner★
https://www.gogojungle.co.jp/tools/indicators/11836
The PDF file contains 301 items (over 1,000 pages, over 350,000 characters in total).
Many of them areexamples that link multiple timeframes logically using the 3 RCI lines, examining higher and lower timeframes in sequence, and ultimately waiting for buying on dips or selling on reversals on the lower timeframes (i.e., mBDSR signals)..
Additionally,there are many that emphasize capturing points where multiple entry reasons coincide..
The explanations usemore than 1,000 charts..

Methods and Case Studies (PDF) ★GogoJungle AWARD2020 Winner★
https://www.gogojungle.co.jp/tools/indicators/11836
【Special Video】 First Session (Includes Viewer Exclusive Indicator)
https://www.gogojungle.co.jp/finance/navi/articles/70917
【Special Video】 Second Session
https://www.gogojungle.co.jp/finance/navi/articles/71083
【Special Video】 Third Session
https://www.gogojungle.co.jp/finance/navi/articles/71151
AUDCAD 1-hour chart
Like the 1-hour chart above,the right peak of the double topandthe mBDSR (filters: RCI26 and RCI52) entering the return selling signallights up,place the stop loss just above the left peak of the double topto achievea trade with a favorable risk-reward ratioand a high edge.
AUDCAD 15-minute chart
Let’s look more closely at the 15-minute chart. In the previously mentioned 1-hour chartthe left peak of the double topandthe right peak of the double topeach form adouble topand, for each,the right peak of the double topshowsthe mBDSR (filters: RCI26 and RCI52) returning sell signallit up.
From this example,the signal characteristics of mBDSR (filters: RCI26 and RCI52)can be utilized to achievea trade with a favorable risk-reward ratio and a strong edge.
Indicator that shines in combination with RCI【BODSOR・mBDSR】
Methods and Case Studies (PDF) ★GogoJungle AWARD2020 Winner★
https://www.gogojungle.co.jp/tools/indicators/11836
The PDF file contains 301 items (over 1,000 pages, over 350,000 characters in total).
Many of them areexamples that link multiple timeframes logically using the 3 RCI lines, examining higher and lower timeframes in sequence, and ultimately waiting for buying on dips or selling on reversals on the lower timeframes (i.e., mBDSR signals)..
Additionally,there are many that emphasize capturing points where multiple entry reasons coincide..
The explanations usemore than 1,000 charts..