

USDJPY 30-minute point and figure chart that broke below the support line
Hello!
FX Research, Satori here.
Today we bring you the “USDJPY 30-minute Point and Figure chart that broke below the support line.”
The figure below is the USDJPY 30-minute Point and Figure chart that has fallen below the price area of the support line being watched this week.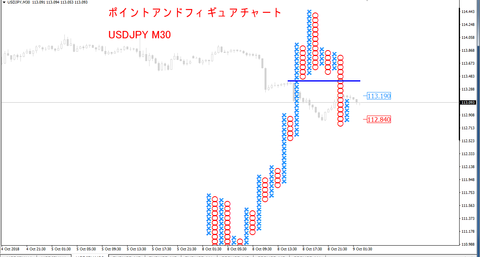
http://livedoor.blogimg.jp/fxmt4indicator/imgs/a/8/a83efaaf.png
In yesterday’s (previous) article, I described the price range being watched this week, but it was easily breached.
When you break below the key support line being watched, the bars move quickly, don’t they?
In the Point and Figure chart, the range has broken downward from congestion, hasn’t it?
Will the previous lower support line now become an upper resistance line and act as a support-resistance turn? I will check daily.
The indicators related to today’s article are as follows.


