

【BTCJPY】20181004 Daily Pivot
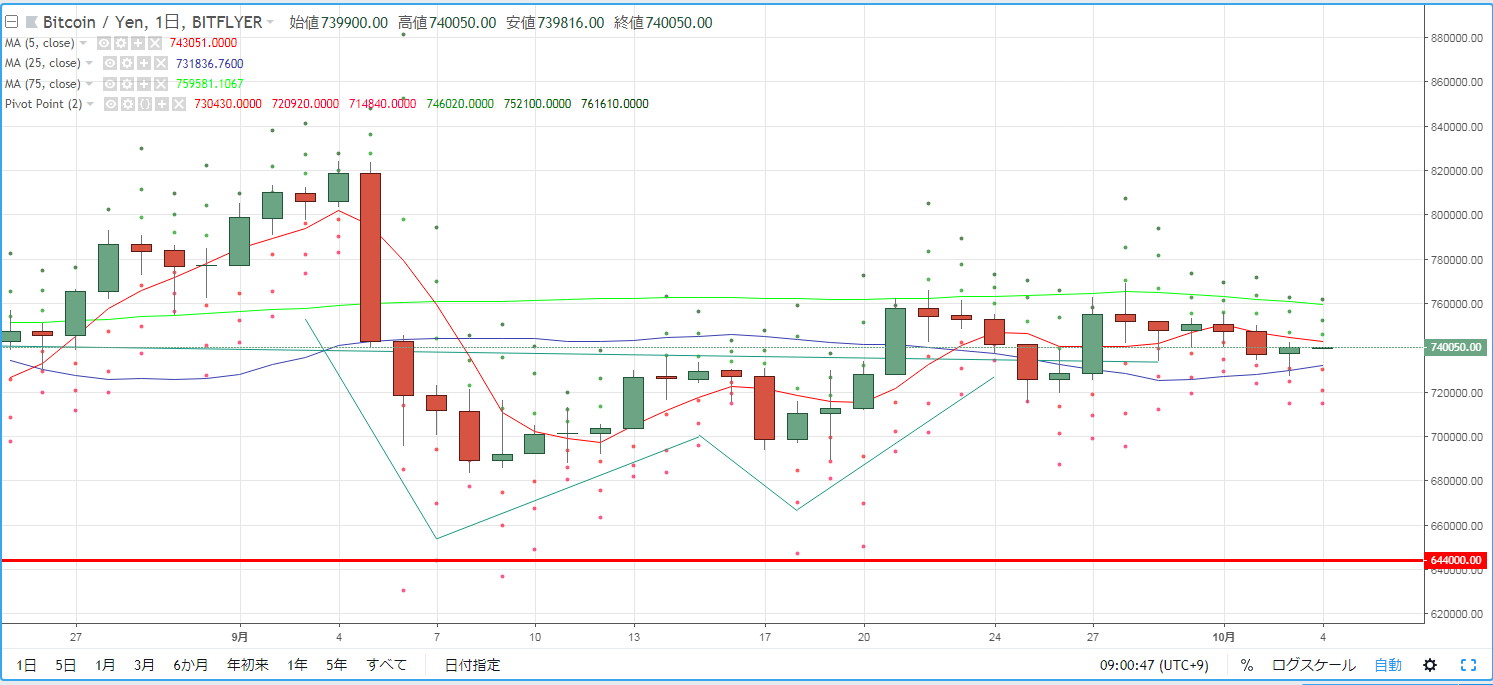
For day trading BTCJPY as a guideline, we check the pivot. Yesterday (October 3) the downtrend from the start continued, there were moments that dipped below the 25MA, but it recovered toward around 740,000 yen and formed a small bullish candle in that market environment.
R2=752,100
R1=746,020
S1=730,430
S2=720,920
*Pivot is a technical indicator that estimates the day's price movement based on the previous day's price action. Centered on the Pivot Point (PP), draw resistance lines (R1, R2) and support lines (S1, S2) above and below, and use them as trading references.
【Calculation Formulas】
Pivot Point (PP) = (Previous day's close + previous day's high + previous day's low) / 3
Resistance Line 1 (R1) = PP + (PP - previous day's low)
Support Line 1 (S1) = PP - (previous day's high - PP)
Resistance Line 2 (R2) = PP + (previous day's high - previous day's low)
Support Line 2 (S2) = PP - (previous day's high - previous day's low)


