

June 3 (Mon): [Bollinger Bands] Nikkei 225 VS Russell 2000
Good morning.
June has already come.
Sell in May and go away. Don’t come back until St Leger day.
“Sell stocks in May, and don’t return until St. Leger Day!”
they say, but
I feel that the Nikkei 225 may have already hit its peak.
With the monthly chart confirming, what new form will it take?
I plan to keep watching closely this month as well.
This time,
I would like to compare with the “canary in the coal mine” lead by a falling market, the Russell 2000.
.
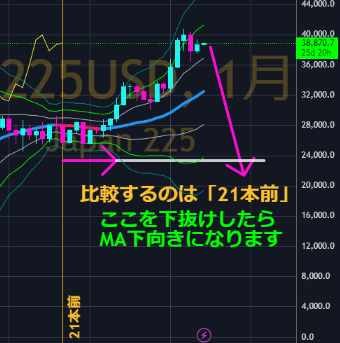
【Announcement: Regarding the vertical line from 21 bars ago】】
We have received inquiries like “it’s a nuisance to count every time,” so I will explain again.
Using the lagging span of the Ichimoku is very convenient.
The lagging span is displayed offset by a certain number of bars, including the current bar, so
When displayed with the setting value “22,” it shows 21 bars ago.
There I draw a vertical line.
With the vertical line, it becomes easy to see whether the rate will go up or down in the future,
and whether the moving average will turn upward or downward in the future,
and how many bars ahead that will be.
That is what becomes visible.
I’ll also display the lagging span on the chart!
【About problems with the newsletter】
● Images in the newsletter crack.
● Font size and font color change by themselves.
These issues are occurring.
Therefore, I plan to try writing without emojis or colors for a while.
There is no change to the content, so please understand…
(The following is for members only.)


