

【BTCJPY】20181001 Daily Pivot
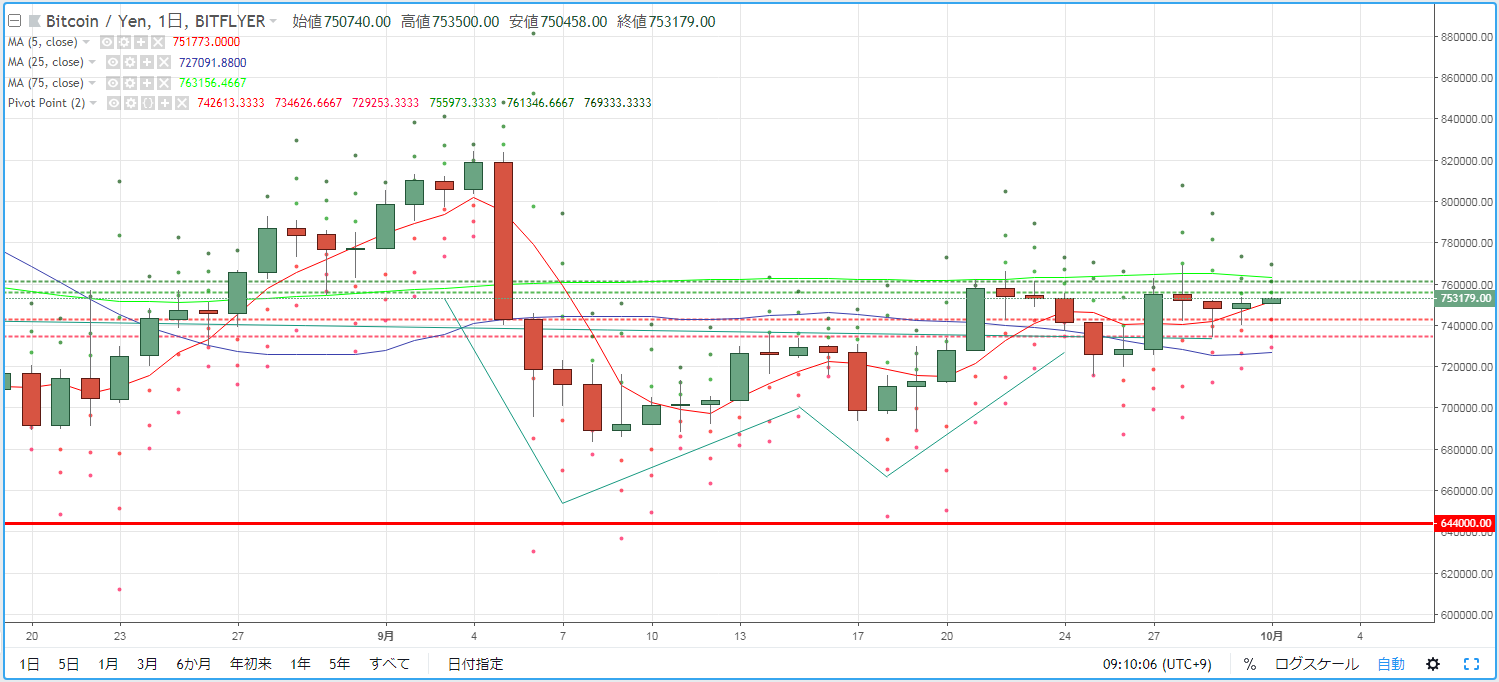
As a guideline for day trading BTCJPY, we check the pivot. Yesterday (September 30) the price temporarily fell below the 5MA, but rebounded around 7.4 hundred thousand yen and was pushed back above the 5MA. It formed a bullish candlestick, but the price movement was in a range-bound market.
R2=761,346
R1=755,973
S1=742,613
S2=734,626
※ A pivot is a technical indicator used to forecast the price movement for the day based on the previous day's price action. Centered on the Pivot Point (PP), draw the resistance lines (R1, R2) and the support lines (S1, S2) above and below, and use them as trading references.
【Calculation formula】
Pivot Point (PP) = (Previous day close + previous day high + previous day low) / 3
Resistance Line 1 (R1) = PP + (PP - previous day low)
Support Line 1 (S1) = PP - (previous day high - PP)
Resistance Line 2 (R2) = PP + (previous day high - previous day low)
Support Line 2 (S2) = PP - (previous day high - previous day low)


